Chapter 2
The Mechanics of Buying and Selling
Now for how to buy, sell or do nothing under the (Automatic Investment Management) AIM system. This is an important, probably the most important chapter of the book. You must thoroughly understand and follow this to get the benefits from the AIM system. I'm going to go through it slowly and I want you not only to read and understand practice it with some stocks of your own until it becomes second nature. And it will! At first it might seem complicated, but it's really incredibly simple. And once you learn it you will be doing exactly the same thing every month but the results will be different. Some months the system will tell you to buy and it will tell you how much to buy or how many dollars’ worth of the investment to buy or how many dollars’ worth of the investment to sell or AIM may want you to do nothing because the price of the investment hasn't gone down or up enough for AIM to decide to make a buy or sell. Here's how to do it.
You will see below that I wrote this chapter a while ago. There still may be some old-fashioned investors don't like computers so this will appeal to them. For the rest of you I have created a Word version of the spreadsheet and you can easily do all of these calculations on an Excel or Word spreadsheet. And you can make it easier by putting in a few very simple formulas in some of the columns and will make your work even easier. Again when you buy my e-book, you will receive all of this information in the Adobe Acrobat version of my book for free and I will provide you with a free version of the spreadsheet for both stocks and LEAPs because the LEAP spreadsheet is a little bit different and you will get up many other fine free bonuses so it's a heck of a deal.
First you'll need to buy or get some 13 – column paper (this is the type of accounting spreadsheets on paper I first used when I went to work as an auditor with the U.S. Army in 1983 which was BC or before computers. Paper is very common accountant/auditor paper designed to write numbers on. Any business supply store will have or at least would have it many years ago; it's probably harder now to find. Again like I said you can easily do all of this on an Excel spreadsheet and I'm sure most of you will prefer to do it on an Excel spreadsheet then to do it with a pencil and piece of paper but for those old-fashioned people I will keep the explanation the same as I wrote it many years ago before computers came around.
Ask your business friends. National makes the paper I use, #45-813. It comes in pads. If you have a computer than any spreadsheet software could be used to set up the system you can find two excellent software programs that do AIM on my website – http://www.jjjinvesting.com
Now a quick explanation of what every column means before we go through two years of one stock and you see the system in action.
Remember like I will say frequently throughout this book, you will obtain all the spreadsheets from the Adobe Acrobat printed version of my book for free after you buy this e-book.
Column 1 DATE - the date becomes the month and year (for example 6/11.) You check your stock at least once a month or more often as you will see when I talk in my book, maybe even daily for some of the more volatile investments like LEAPs or leveraged ETF's. You will see in this example in Chapter 2, I am just going to be checking the stock monthly. And you will see just checking it monthly can still make you quite a nice profit. So 6/11 would be followed by 7/11, followed by 8/11 - I think you get the picture.
Column 2 REMARKS - here you will list things such as readjust stock/cash ratio, stock splits using different SAFE percent’s (10% is the normal SAFE amount as you'll see later on) but we will use different SAFE percent’s in bear markets.
Column 3 – SHARE PRICE - this is the closing price of one share as reported in the newspaper or the website for the day you’re checking. You can easily find daily prices at http://yahoo.com in the financial section or if you have an iPhone, all you have to do is click on the stocks application on the front of your phone and there you find the latest prices on any investments that you're interested in.
Column 4 – SHARE VALUE - this is the SHARE PRICE from column 3 multiplied by the number of SHARES OWNED which is found in column 8.
Column 5 SAFE – SAFE is an arbitrary 10% of the share value found in column 2. Thus if your SHARE VALUE is $5,000, your SAFE amount would be $500. You'll see how SAFE helps you from buying and selling too soon when we go through the actual example stock.
Column 6 – CASH - originally Robert Lichello said to use a ratio of 50% CASH and 50% shares when you start an AIM investment. So for example, if you started with $10,000, you would have $5,000 in stock, and $5,000 in CASH. I have found that we can vary the amount of cash in an AIM investment depending on the volatility of the investment. A quick example is on a LEAP which is a very volatile investment; you would always want to use a ratio of 50% CASH and 50% LEAPs. And on a closed-end fund that you buy for income, you can safely use a ratio of one third CASH and two thirds closed-end fund shares that would mean on a $10,000 investment, you could own $6,677 worth of closed-end fund shares and $3,333 for CASH. One disadvantage nowadays of keeping a great amount of cash in your broker’s money market account, is that money market accounts pay a very low interest rate usually less than 1% which means you're not earning very much on the money but having cash to buy shares at cheaper prices is an essential that will pay off for you later on when your stock or other investment goes down and you need to buy more shares. Your CASH total will go up or down every month depending on whether you're buying and selling and earning interest on your cash. Also I view it as optional if you want to deduct the cost of the commissions as you make buys and sells. Personally I wouldn't bother worrying about the commissions you make enough profits without really worrying about it.
You'll see that the AIM system is very conservative as most of your investment will go to CASH. If you have a buy, then Column 6 (CASH) –, Column 11 (MARKET ORDER BUY) X 1.005 (interest) equals next month's cash total. If you have a sell, then, Column 6 + Column 11 (MARKER ORDER (SELL) x 1.005 equals next month's cash total.
Column 7 – SHARES BOUGHT (SOLD) - After you make your monthly check of the stock or other investment price, you might be buying some shares, selling some shares or doing nothing. In this column you will record the number of shares you bought or sold for that particular day in time. If you did nothing, put – (dash) in the column. To arrive at the number of shares you bought or sold, you divide the dollar amount in column 11 (MARKET ORDER BOUGHT (SOLD) by the SHARE PRICE in column 3. For example, if the system tells you to sell $200 worth of stock and the stock is selling for $10 a share, then you sell 20 shares. Remember to put the ( ) around the sold stock to keep separate buy and sell transactions which are sharing the same column.
Column 8 – SHARES OWNED - This is the number of shares you currently own. This figure will constantly go up and down. If your stock splits, you would double the number of shares you own. Column 8 equals last month’s column 8 plus any shares you bought in the previous month or column 8 equals last month’s column 8 minus any shares sold in the previous month or day that you did AIM. If the previous month or day that you did AIM and AIM told you don't need to make any buys or sells then column 8 would be the same number of shares in the row just above the current row you're using.
Column 9 PORTFOLIO CONTROL - Another important column. When you start, put a dollar amount equal to the amount of stock you bought (this is only a control number, no money involved with this column.) If you start with $1,000 worth of stock, your PORTFOLIO CONTROL amount/number is also 1,000. After your initial injection of money, PORTFOLIO CONTROL will only change if you buy more stock. Every time you buy more stock, you add half the amount you bought to your PORTFOLIO CONTROL total. For example, the system tells you to buy $400 worth of stock; you add $200 to your prior PORTFOLIO CONTROL total. If no buy, then column 9 is the same as the prior month.
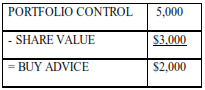
Column 10 – BUY (SELL) ADVICE - Every month you look at your SHARE VALUE (column 4) and PORTFOLIO CONTROL.) If your SHARE VALUE is higher, you put that figure on top; if you're PORTFOLIO CONTROL amount is higher, you put that on top. For example: if your SHARE VALUE is $5,000 and your PORTFOLIO CONTROL amount is higher, you put PORTFOLIO CONTROL on top. For example: if you're SHARE VALUE IS $5,000 and your PORTFOLIO CONTROL is $3,000 then you would put the higher value on top like this:
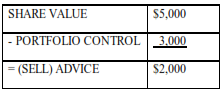
Or if PORTFOLIO CONTROL is higher:
Column 11 – MARKET ORDER BUY (SELL) - this is the column that tells you whether you make an order or not. You take the amount from column 10, BUY (SELL) ADVICE, and subtract out the SAFE (column 5) amount. If the amount is over $300 (this is my new rule of thumb for determining when you make actual buys or sells.) This means you go online and tell your broker that you want to buy or sell the dollar amount of your MARKET ORDER. If you have a sell order, you have to figure out how many shares you must sell (column 11 divided by column 3, SHARE PRICE) and tell your broker to sell that many shares. For example, if your market order was to sell $300 worth of $8.10 stock, then you would tell your broker to sell 37 shares. You would do the same exact thing if it's a buy order, you divide the dollar amount of the buy order by the current price of the stock and that determines how many shares you buy. Always remember investing is an art and not a science, so if the AIM system tells you to buy 37 shares, then you can easily round that off to buy 40 shares and everything will work fine.
COLUMN 12 – 6% INTEREST - this is the amount of interest earned by your cash total from column 6. The .005 is 1/12 of 6% or the amount of interest you earn in one month. I picked 6% because it's easy to work with an overlong period of time and is a fair average of the interest rate for money market funds over the long-term and it keeps things simple – monthly interest is always one half of 1%. I know right now that interest amount seems very high compared to what money market funds are paying but remember we are in this for the long haul and if you play AIM over the next 20-30 years it will average out to 6% interest as a fair number of use.
Column 13 – PORTFOLIO VALUE/TOTAL - Add the value of your CASH, column 6 + column 4, the value of your stock or other investment and you have the total current value of your investment. You will notice one nice thing about the AIM spreadsheet. Once you start with the stock you see exactly what you're starting amount is in the very first row when you look at PORTFOLIO TOTAL. In this example we are starting with a PORTFOLIO TOTAL of $10,000.
So when you compare PORTFOLIO TOTALs in the future rows, you can easily see exactly what your status is, if the PORTFOLIO TOTAL is higher than $10,000 then you are ahead or profitable. If the PORTFOLIO TOTAL is less than $10,000, you currently have a "paper loss". All that means is that the stock or other investment is cheaper than when you originally bought it, and possibly AIM is telling you to buy more shares of this cheap stock so when it turns around and goes higher later on you will own more shares that will go up in value and that will increase your profits.
Now I will go through an actual stock and show you just how easy it is. Get your pencil, calculator, and 13 – column paper or your Excel spreadsheet. Write all the headings in the proper columns. Remember you will get a copy of my book in the Adobe Acrobat version that will have the spreadsheet illustrated to make it easier for you to understand. Now write the name of the stock, for this example I picked Claire’s Stores, see the chart at the end of this Chapter in the Adobe Acrobat version of the book. Then below the name list the stock exchange, NYSE equals the New York Stock Exchange. The first month in our example is June 1994 (6/94), write that in your date column. Then we are going to imagine that we have $10,000 to invest. Having a calculator will make your figuring easier. Now let's start with June 1994.