The best way to enter the market is by
using “Stop Orders” and “Limit Orders”.
When the orders are placed, they are located on the broker's server, so you can safely leave your trading platform. This brings you freedom from trying to spot the best entry point.
The entry rule is simple:
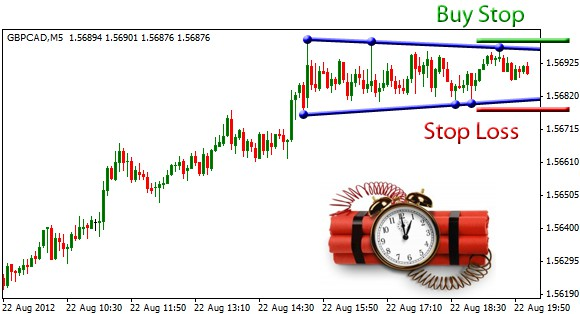
1. If you trade a pattern in an uptrend, place a Buy Stop just above the upper trend line. Where exactly? You may want to place it 5 pips above the trend line to spot the real breakout. The advanced approach is to reflect the market volatility as we will discuss it later.
2. Place a Stop Loss just below the lower trend line.
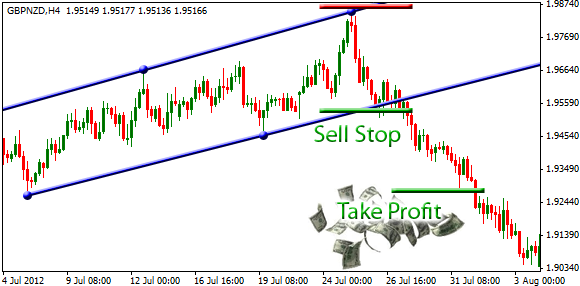
3. If you trade a pattern in a downtrend, you do just the opposite – place a Sell Stop order below the lower trend line and a Stop Loss above the upper trend line. More in the Exercise.
The interesting part is when to Take A Profit. Many traders enter the trade blindly without any idea where to exit! Notice that the Stop Loss below the trend line reflects the current market volatility. It is not (and never should be) a fixed number of pips. The same should hold for the Take Profit. You cannot just decide that 50 pips is enough and you would exit the position. 50 pips is very different on minute time frame and daily time frame.
There are two great methods to find the Take Profit level:
1. Projection method – easy
2. Fibonacci method – using several Take Profit levels, a little complex, but better
Let's focus on the first one; The Projection Method.
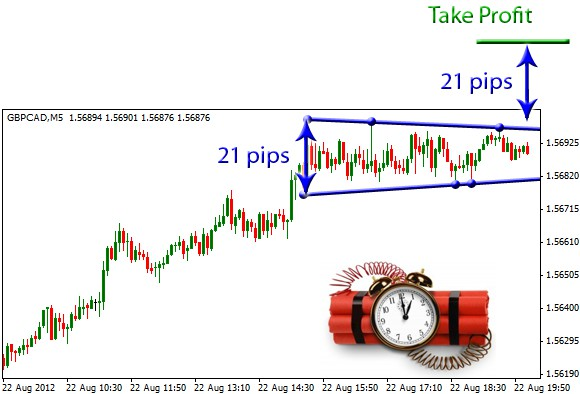
1. Measure the greatest width of the pattern.
2. This pip value will be used for the Take Profit.
Use the same method for triangles, wedges, flags or single trend lines. As the market breaks from the choppy zone, it normally travels at least the projected distance.
One note about the flags and wedges;
As the price travels between the boundary lines, it happens that the trend line is not broken and the pattern becomes deeper, or even no more valid. In such a case cancel the order and place a new one to reflect the current situation. Sometimes the situation is not going as you had planned and the price breaks through the other trend line. Then simply cancel the order and forget the pattern. Rather not taking the trade than taking a bad trade is the key of successful trading. There will be plenty of other opportunities!
Keep in mind that chart patterns can appear and disappear, or morph into another patterns. An emerging pattern is not confirmed until the relevant trend line is broken.
Exercise
First, let's look at the clean chart below. There are several significant highs and lows that can be connected with a trend line. Before the choppy zone we see a minor uptrend, so we are going to complete the pattern and place a buy order.
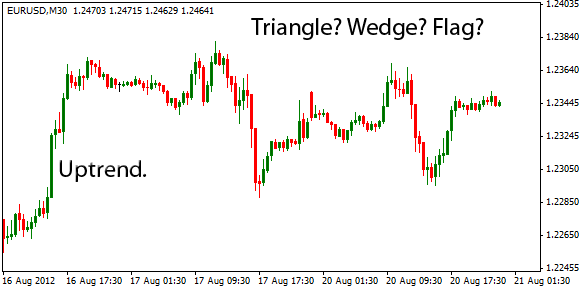
There is just one way to draw the two trend lines that meet the guidelines. These trend lines are forming a triangle pattern.
1. Place a Buy Stop order just above the upper trend line.
2. Place a Stop Loss Order just below the lower trend line.
3. The distance of the highest high and the lowest low of the pattern is 93 pips, so this is the pip value for the Take Profit.
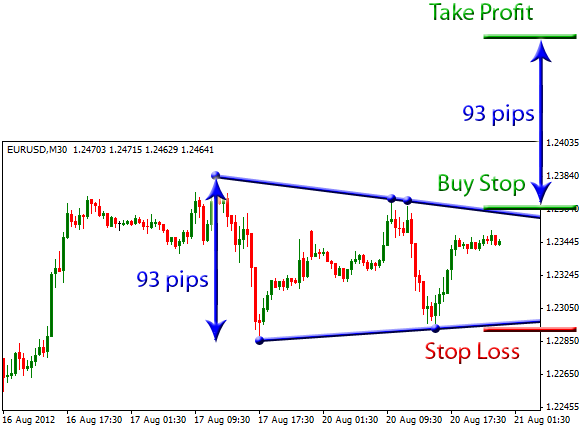
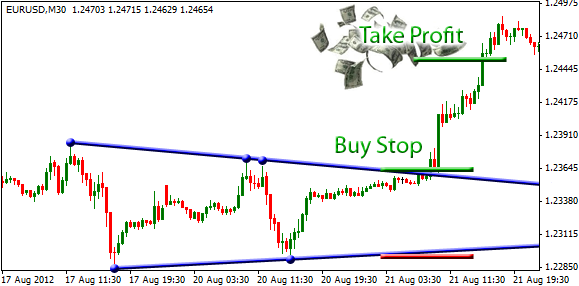
As the pattern continues to grow, you can replace the Buy Stop order a bit lower to the trend line, but it's not necessary. Finally, the upper trend line is broken, the Buy Stop order is executed and the Take Profit is hit!
Another example:
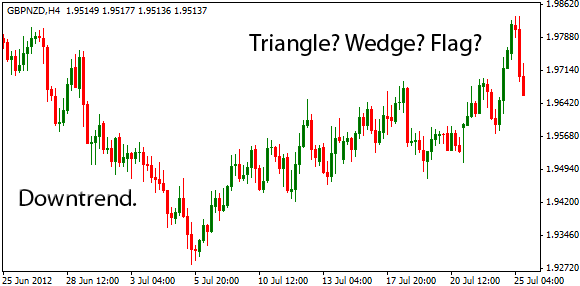
A minor downtrend is preceding some pattern. The lower trend line is obvious. What about the upper trend line? It's not completely obvious; there are several ways to complete the pattern into triangle, wedge or flag. We would prefer a flag because triangle or wedge would be too wide and the Take Profit would be too far (unless you use a more complex Fibonacci technique for several Take Profit levels).
Now the well-known techniques are made in the opposite direction:
1. Sell Stop order below the lower trend line,
2. Stop Loss above the upper trend line,
3. Projected Take Profit.
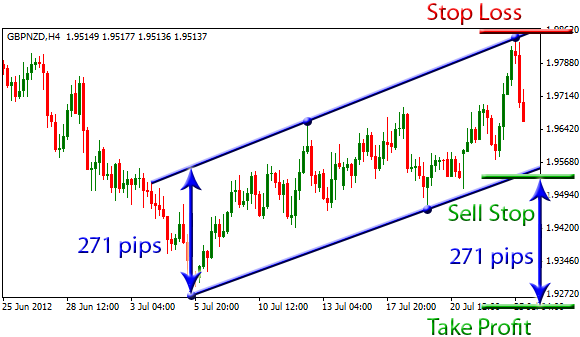
The trend line is broken, the Sell Stop order is executed and we make money in a downtrend until the Take Profit is hit. As we use a single Take Profit level, the downtrend continues without us... let it go!