If you want to stretch your signal farther than just across the street, you're going to have to consider exactly what lies between the points of your network. In Chapter 2, we looked at using USGS topographic maps and DOQs to estimate how the land lies between two arbitrary points. In addition to paper and online topographic maps, CD-ROM versions have been around for a few years. While typically geared toward hikers and outdoor enthusiasts, they have a lot to offer the aspiring wide area network engineer.
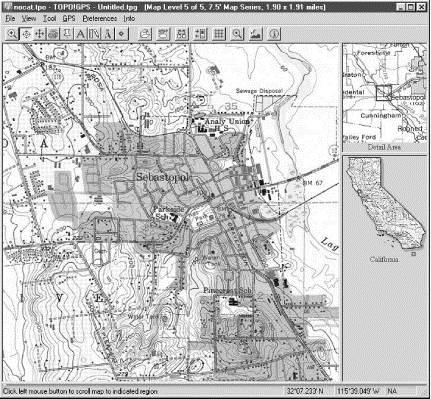
6.1.1 SoftwareI have evaluated two popular commercial topo packages, Topo! by National Geographic, and DeLorme's TopoUSA 2.0. Figure 6-1 shows a Topo! rendering of Sebastopol, California. While they're both packed with features, only a few are directly applicable to helping analyze land between two points.
Figure 6-1. A Topo! rendering of Sebastopol, CA
 Here are some points to keep in mind when evaluating topo software for link analysis:
 • The software should provide cross-section views of a route or drawn trail. This is probably the feature used most often in trying to figure out if the land will cooperate (see the next section for examples).
• Almost any self-respecting topo software package includes the ability to mark up the maps with points and text. The ability to import lat/lon data and translate them into data points is handy if you know a site only by its latitude and longitude.
• If you intend to use a GPS with your software (see the next section), make sure your topo software supports your GPS hardware. Both packages I evaluated support most popular GPS hardware and the NMEA data standard (which virtually all modern GPS receivers speak).
• Both packages I currently use are for Windows only. There are lots of Linux mapping packages floating about that render USGS DOQs and DEMs, but, like a lot of Linux software, it may take a bit of fiddling to get them going. Check out the mapping resource links at the major community wireless sites (see Appendix A), as this is an area of rapid development in the open source community.
Whatever software you choose, it should make it easy to weed out, at a glance, the obviously impossible direct links. If you get a "maybe" (which is frequently the case), you'll just have to go out and try it. Of course, for most of us, that's the fun part.
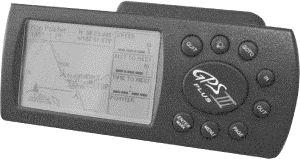
6.1.2 Using a GPS to Log Prospective Lat/Lon/AltWhenever I visit a potential node site, I bring my GPS with me. It logs not only the (more or less) precise latitude and longitude, but also the altitude of the site. This is data you can estimate with a topo map, but it can be handy to have a precise measurement (particularly if you have logged several points in your intended network path). Figure 6-2 shows the use of GPS to tag potential sites.
Figure 6-2. You can use a GPS to tag potential sites and analyze them later in software
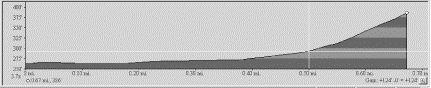
After collecting points, you can pull them into your topo software and plot them. Draw routes between them to figure out how the land lies between the two points. Figure 6-3 shows a Topo! rendering of a site. Based on this representation, the shot should be a piece of cake.
Figure 6-3. Good topo software should be able to give you a cross-section lay of the land between any two points
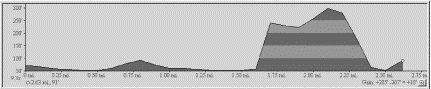
Keep in mind that, although the topo software has surveyed geological data, it won't have tree or building information. You can get a general idea of how cluttered an area is, but you won't really know until you try the shot. Using the overhead view in conjunction with the cross section, you can not only weed out the obvious negatives, but also find potential workarounds. Figure 6-4 shows a site that wouldn't work. Maybe you can go around it? Who lives on that hill, anyway?
Figure 6-4. This cross-section shows the long distance nightmare: no chance
Using the overhead view to locate key repeater points can be fun. Find out where the good sites are, and try contacting the people at those points. More often than not, people are willing to work with local community groups to provide free access (particularly if they don't have to do much besides provide electricity, and they can get free high-speed access besides).
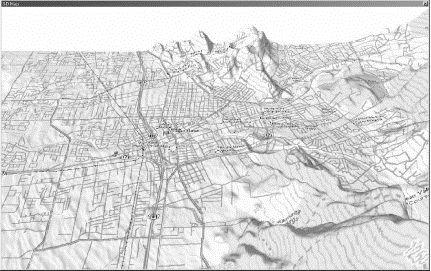
6.1.3 Plotting the Points on a 3-D MapDeLorme has the interesting ability to create 3-D renderings of a topo region, complete with data markers and labels; Figure 6-5 shows a rendering. While it's a really cool feature (and very catchy in presentations), it has limited practical value beyond helping to visualize the surrounding terrain. Of course, if you have a whole bunch of data points, it can make for an impressive visual presentation.
Figure 6-5. DeLorme's TopoUSA gives you a 3-D rendering of any topo region, complete with data points
Once your points are plotted on a map, you can very quickly determine which sites are worth developing. If you can't get direct line of sight to a place you'd like, take a look at the surrounding geography and see if you can find another way. If you can't go through, you'll have to go over or around. Software topo maps can make finding the "bank shots" much easier.