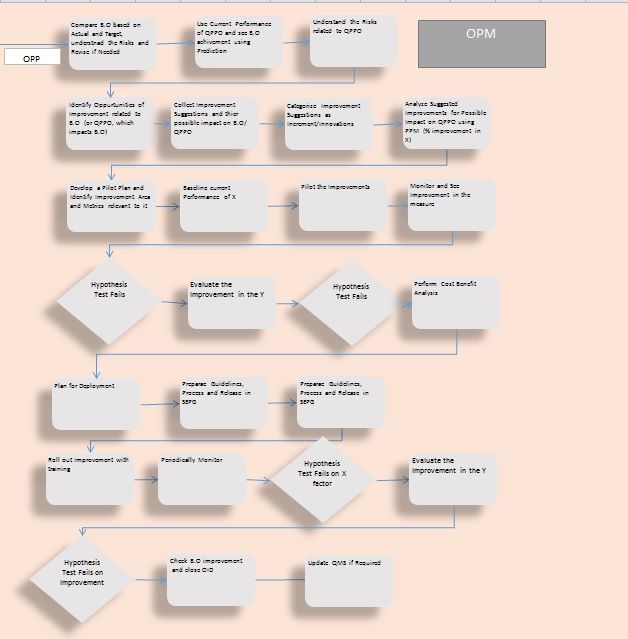
Driving the Innovation/Improvements to achieve Business Results
Driving Improvements to achieve Business Objectives:
As an Organization we have identified the Business Objectives to be achieved in the near future and have organized our projects to align themselves towards these objectives. The projects are direct contributors to achieve the business objectives as they produce results to be achieved and support functions are aligned to ensure that projects could achieve these targets. In such scenario, we will be monitoring the performance of projects results from the point of view of achieving business objectives on periodical basis. This could be quarterly basis for an annual business objectives or half yearly for Business objectives targeted biyearly basis and so on. The regular understanding on business performance with the help of actual business results and how the Quality and process performance objectives have been performing, helps the SEPG and Senior management to identify improvements needed in the Organization’s Process performance. Typically set of process initiatives which are new innovation or improvements could be identified regularly, which would overcome the challenges and boost the business results achievement would be part of their charter. Thus such initiatives helps to improve QPPO achievements and there by Business Objectives achievement. These initiatives are tracked to deployment, so that the entire organization (as applicable) gets the benefit in terms of improvement from current state. Hence its like Organizational Stock taking on performance versus target and bridging the gap or moving above limits using process improvement initiatives on ongoing basis.
Revising and Updating Business Objectives:
The SMART Business Objectives set in the Organization on a given time, might have been achieved in a period of time or the Organization would have understood that the targets are too wide or high or low so they may want to revise them. In addition the Business Objectives could have been no longer valid when the business scenario changes. Hence its important to periodically monitor the Business Objectives suitability and the targets suitability, if needed they have to be revised. As we revise the Business Objective the QPPO which are aligned with that will also to be revised. In addition the relationship established between the QPPO and Business Objectives could differ in a given time period in certain contexts, hence its important to see the relationships are still valid in the similar level. Also within Business objectives and QPPO also the priority may have shifted, so the prioritization to be checked on regular basis. The Senior management team along with SEPG can do meetings on periodical basis to verify the performance and take necessary actions.
Analyzing the Performance Results and Identify Potential areas of Improvement
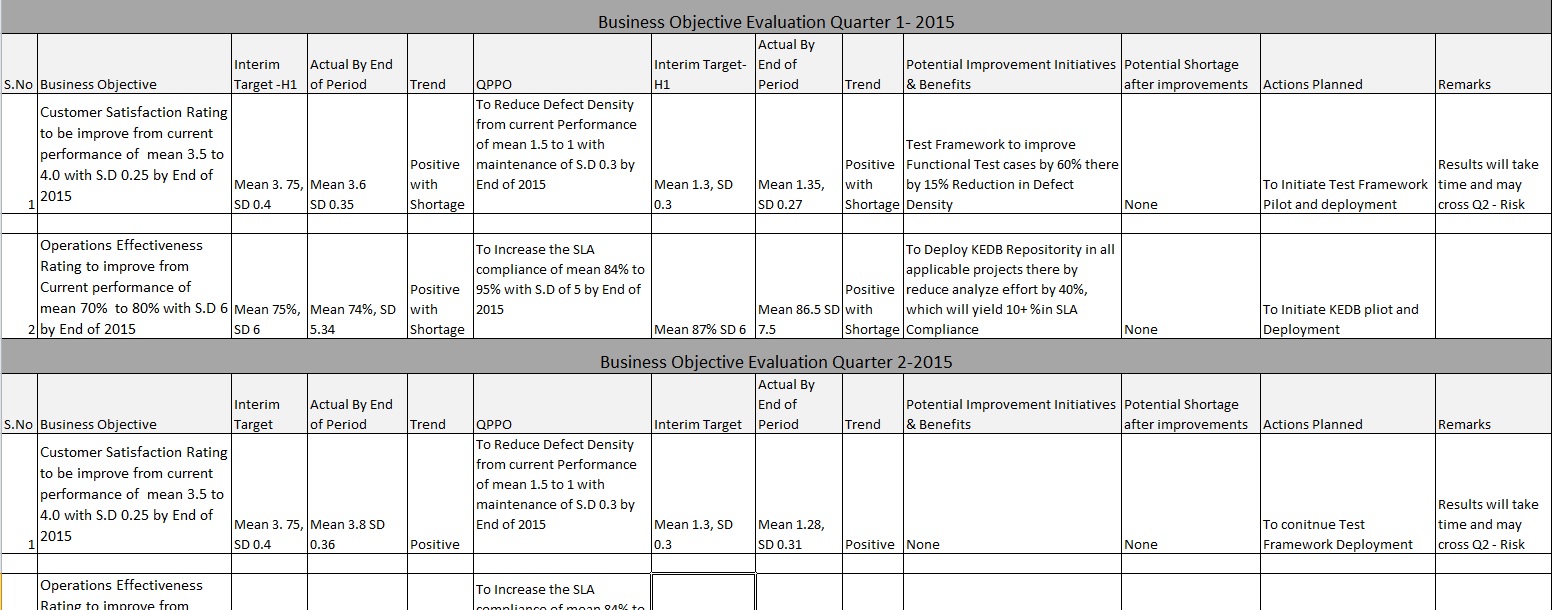
On periodical interval the Business and Process results to be analyzed using relevant quantitative and statistical techniques. The Shortage in Business performance results to be studied and the actions to be identified, in addition any potential area where improvement initiatives can be run to be also identified. Typically along with Process Performance Baseline preparation the Business Objectives results achievement for the period to baselined and using the values of BO and QPPO actuals, we can compare and understand the improvements in results. As the Business Objectives could be for a given time period the organization may have interim targets identified for periods, so on the given period what should have been the results which will help your organization to achieve the Business objective on annual/biyearly or for a give time could be understood. So its expected that the results are compared with Interim targets in the interim periods to make the comparison meaningful. Where there are shortages they have to be noted and the areas relevant to that BO/QPPO can be the potential areas for improvement Initiatives. These areas can be discussed with senior management by SEPG and actions can be planned. In the Initial periods , we may not be clear on what type of initiatives on how much they would benefit in the given area, however as the initiatives go to the next level, we will be having adequate information on how much these initiatives will contribute.
Many a times organizations ask, how many improvement initiatives are needed for CMMI High maturity. The answer is CMMI don’t decide it, but your Business Goals decide, your performance decides it. CMMI Is a performance based process Improvement model , when it comes to high maturity. Here the entire idea of having Improvements/innovation is to find your shortages in performance or your performance improvement needs and have that many initiatives. From an appraisal point of view it could be even one is sufficient, but is that what your organization need is, that you have to decide.
A table given below could be the way these analysis and performance related process improvement areas could be identified,
Techno Process Innovation Group and its functions:
The Organizations Operating at maturity level 5 of CMMI to have a group like Techno Process Innovation group, which can understand the technical and process needs and able to innovate or improve the processes. The aim should be to continuously improve the performance using the modern technologies and process designs. The group can comprise of technological experts and process experts and can be extended arm of SEPG or Separate function as per the need of the Organization. The group shall meet on regular intervals to find new suggestions and opportunities to innovate or bring best practices from relevant industries or to experiment a projects success factor at organizational level, etc.
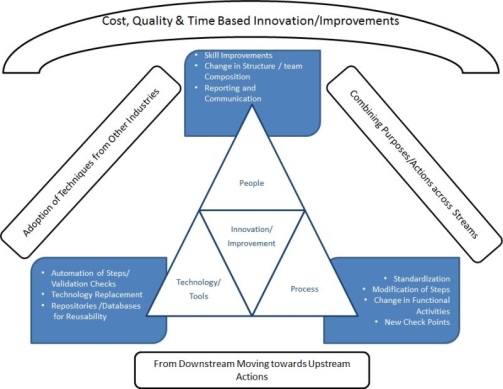
Typically in software industry the problems are very close to Time, Cost and Quality factors and our innovations/improvements are also focused to them. Innovation is achieving beneficial results in an unexpected way and its significantly different from current way of performing to get the results. From product point of view Innovation can be significant addition/modification of functionalities in product which achieves beneficial results. Whereas improvements are incremental in nature to the current way of performance and it could be addition/modification to the current functionalities in product. The following chart helps in identifying improvements to the current performance factors.
Collect improvement Suggestions and select appropriate Suggestions:
Improvement suggestions should be collected in an organization on periodical basis. The organization shall have mechanism to collect and analyze them on regular basis, which means a group like Techno Process group looks at each suggestion and make decision to go ahead or not. The suggestions can come from,
*Employee Suggestion/Feedback Box/online form
*Appraisal/Audit Reports
*Process/Technological Workshops
*Customer Feedback/Survey
*Improvements survey
*Management Review sessions
*Brainstorming meetings of Techno Process Group
*Others
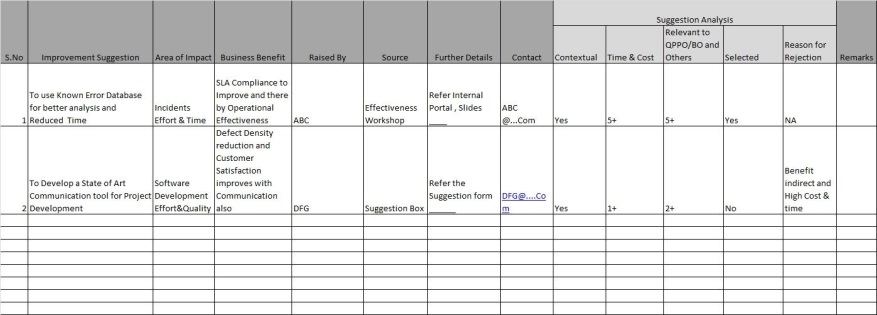
These suggestions to be captured in a particular format to ensure the relevant information are there. The details on person who raises these suggestions, the impact on BO/QPPO and its relevance, expected benefits and further additional details to be captured in the Process Improvement suggestion log/tool.
Similarly each suggestion to be evaluated for probable cost, time it will take and contextual relevance and BO/QPPO Impact. When there is benefit assumed then it has to be selected for next level analysis or for further deployment. Not all the suggestions may be relevant to BO/QPPO but it can be relevant to people and working environment ,etc in such case also the improvement has to be considered for deployment, however the rigor of application of statistics will not be there, but can have minimal quantitative analysis.
The selected improvements has to validated for further deployment, this could be achieved by having conference room simulation, prototype, expert reviews and piloting, etc. Many organizations chooses piloting as default technique for all improvements, which is not necessary. For example the improvements comes from causal analysis of a recent project which has benefitted in achieving its project level objectives, then do we still need piloting or if the improvement is on developing a tool for addressing some of the process needs then is it possible to have piloting, the answer is no. The model never describes piloting as the only methodology for validation, however its very common to see the organizations and certified individuals push for piloting as safe mechanism to validate improvement suggestion.
In our case of SLA Compliance (QPPO), the analyze effort is on higher side and it can be reduced using the improvement of KEDB (Known Error DataBase) implementation in the Organization and relevant tool is also recommended in the suggestion. A initial study and data collected from different past engagements reveal that there is a negative correlation exists.
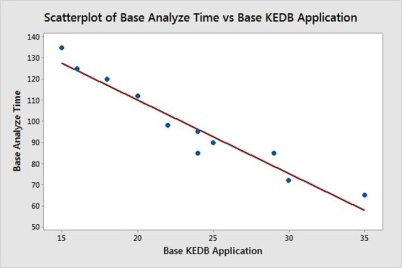
However the Organization is not clear whether it will work well on other complex technologies and to understand the benefits clearly they decided to pilot.
A pilot plan can be something like this (contents are detailed ones)
Pilot Plan:
Objective:
To Improve Analyze Time by 40% by using KEDB application, thereby Improving SLA Compliance by 10%
Pilot Applicable:
Project A and B to be the Pilot Projects
Pilot Schedule:
*Task 1 – starts on 10 Mar 15 and Ends on 18 Mar 15- XBS Responsible
*Task 2- starts on 21 Mar 15 and Ends on 28 Mar 15- ASS Responsible
*Task 3 - starts on 01 apr 15 and Ends on 28 Apr 15- DSB Responsible
*Others……
*Evaluation of Pilot – Starts on 01 May 15 and Ends on 10 May 15 – XBS Responsible
Stakeholders:
Project Teams, Senior Management, and Improvement team
Provide complete Involvement matrix
Environment Needs:
….
Pilot Success Criteria:
*All Projects Implement KEDB
*Minimum of 30% Reduction in Analyze Effort atleast in Repetitive incidents
*Minimum of 5% Potential Improvement in SLA Compliance using PPM (actual for the given month is better)
Pilot Exit Criteria:
*Completion of All tasks
*Projects not able to progress to complete the tasks
Measurements:
Time and Cost Spent on Piloting and Impacted Results as per Success Criteria will be measured.
Others:
…………..
After piloting the KEDB for the given period the Organization realizes certain improvements,
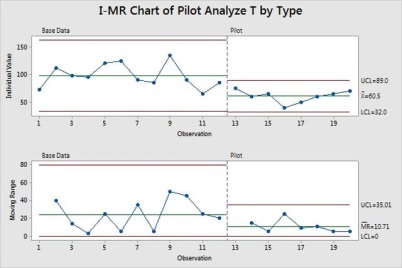
Analyze Time has reduced significantly
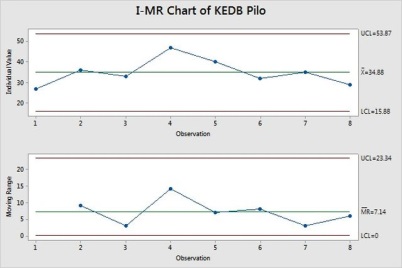
Similarly the KEDB application is stable in projects,
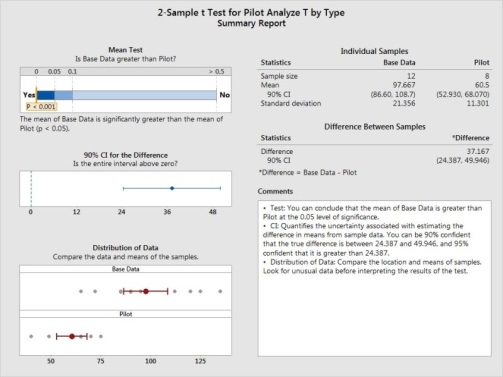
There is an improvement in the SLA Compliance with Piloting of KEDB
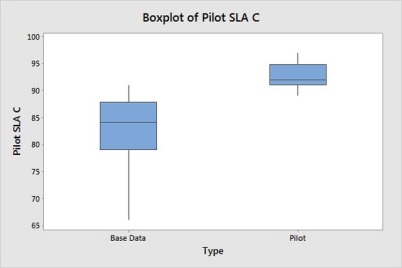
Further the pilot results are published,
*Improvement seen in Analyze Effort – mean Shifted from 100 to 60 (approximate 40% improvement) and SD remains same
*Potential Improvement in SLA seen by 5% Improvement, which crosses the Penalty value of 80% Compliance.
*Its Practical to implement and High Support Received from Project Team
Improvement in Moral is visible in Project
*Cost & Benefit:
Pilot Effort for KEDB Implementation = Person Days * Cost Per Day => 5* 120 =600$
Benefit: Penalty on atleast 5% of tickets on SLA Compliance is reduced = % improvement* No.of ticket crossing SLA* Penalty Value=> 0.05*50*500=1250$
Reduction in Analyze Effort, there by Team works on Enhancements = Person Days * Cost Per Day* People in Project=> 0.09* 120*50= 540
Total Benefit in Month= (1250+540)-600=1190$
*Recommended for Deployment based on Time to Implement, Benefits Realized and practicality in application.
The Report is submitted for approval with senior management for further steps in to deploying them across the organization (as applicable). Once the approval is attained then the improvement suggestion is taken for deployment.
Where pilot results are not encouraging the Improvement suggestion can be dropped with a clarity that it’s a failed pilot program and it will not be taken for deployment.
Deploying Process improvements and evaluating them:
Deployment needs preparation and strategy before get on to the field for application of improvement solutions. The improvement solution should be clearly drafted, where applicable the tools to be made available or created, relevant manuals to be ready, Process changes submitted to SEPG for release in QMS, Training the relevant Stakeholders, etc to be prepared before deployment. The deployment strategy could be of identification of phases in deployment, change management needs, criticality and prioritization of deployment, entry and exit criteria for deployment, stakeholder involvement, managing budget for deployment, etc
Typically a deployment plan is prepared once the initial preparations are done with the improvement solution,
Deployment Plan:
Deployment Team:
SEPG
Improvement Team
Scope of Deployment:
All Application Maintenance Engagements which have SLA as QPPO
Deployment Approach:
Inventory of AM Engagements suited to apply the improvement
Communicate usage of KEDB to the selected AM Engagements
QMS Update
QMS is to be updated with generic KEDB template if applicable
Tracking Mechanism:
Bi-weekly checks
Monthly Monitoring of values
Deployment Schedule:
*Current Baseline and Individual Planning for Projects – starts on 10 Jun 15 and Ends on 18 Jun 15- XBS Responsible
*Training Teams- starts on 21 Jun 15 and Ends on 28 Jun 15- ASS Responsible
*Handholding usage of KEDB - starts on 01 Jul 15 and Ends on 28 Sep 15- DSB Responsible
*Others……
*Evaluation of Deployment – Starts on 01 Nov 15 and Ends on 20 Nov 15 – XBS Responsible
Deployment Exit & Success Criteria:
*Completion of All tasks
*Completion of Deployment Schedule
*Projects not able to progress to complete the tasks
*Success Criteria – Atleast in 80% of projects Analyze Effort reduced by 30% and SLA Compliance improved by 5% or more
Stakeholders Involvement:
…..
Measurements:
Time and Cost Spent on Deployment and Impacted Results as per Initiative will be measured.
Risks and Strategy to Encounter:
……..
Others:
……
The deployment to be performed as per the plan, in addition a deployment of process improvement shall be a time boxed process/technical handholding activity with concentrated effort. Once the tasks are completed the organization should close the deployment and leave it to regular support. Which means the Quality management system and regular organizational structure & system is now capable in handling the solutions. In other words, they are institutionalized and no need of separate effort through deployment to handhold. Once the deployment is performed the deployment results to be statistically validated,
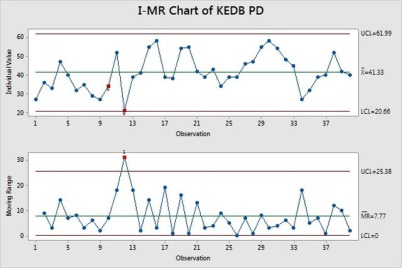
KEDB implementation in control (the outlier are not removed in this case)
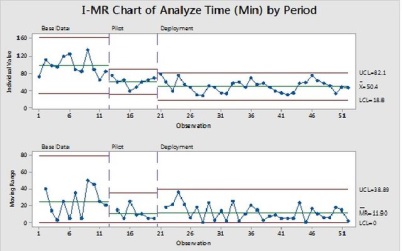
The deployment results on Analyze Time is similar to those of piloted projects and its supported by the relevant statistical tests (box plot, Hypothesis test – not included here)
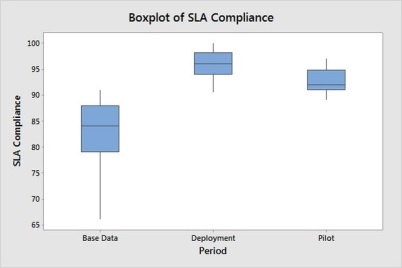
Similarly we could see improvement in performance on SLA Compliance in the pilot and deployed projects.
Revising Process Performance Model:
Once there is change observed in X factors performance baseline then immediately its important to understand that no longer the process performance model with past performance may valid. So the model can be reconstructed with new values in some cases (static models) or just re-caliberation of model in some cases (dynamic models).
So in a similar case on Defect Density (QPPO) where the functional test case numbers are pretty low and new test framework standards are introduced by the organization to improve the quality and quantity of functional test cases as improvement suggestions the following are the typical charts which may be established with relevant statistical tools application.
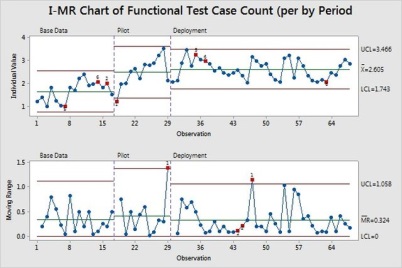
(Functional Test case count increase – outlier not removed with relevant reasons)
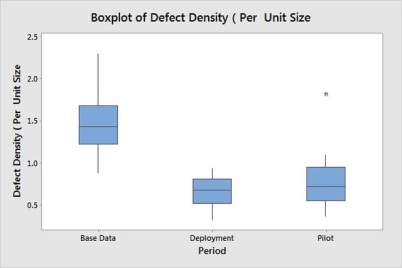
Improvement observed in Defect Density by reduction.
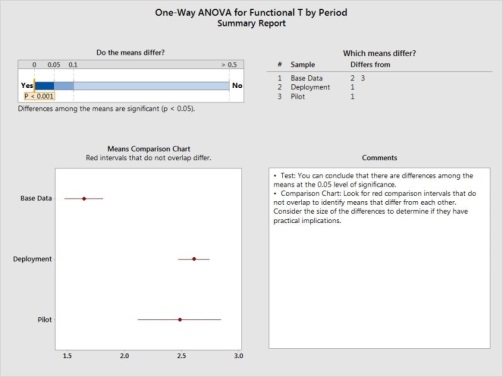
Here the factor of influencing is the usage of test framework on all the modules, which will be discrete in nature (Yes/No) the results of their impact with functional test case count can be studied with ANOVA.
Once the deployments are evaluated they are closed with lessons learnt and completion report. The reports to be submitted to SEPG for future reference and also can be published with organizational repository.
Again don’t forget to link that this an organizational Performance management tool, so all the results are evaluated to see it makes the life easier for your organization to achieve the business objectives. Hence the real success of an improvement remains in achieving the business results.
What we have covered:
SG 1 Manage Business Performance
SP 1.1 Maintain Business Objectives
SP 1.2 Analyze Process Performance Data
SP 1.3 Identify Potential Areas for Improvement
SG 2 Select Improvements
SP 2.1 Elicit Suggested Improvements
SP 2.2 Analyze Suggested Improvements
SP 2.3 Validate Improvements
SP 2.4 Select and Implement Improvements for Deployment
SG 3 Deploy Improvements
SP 3.1 Plan the Deployment
SP 3.2 Manage the Deployment
SP 3.3 Evaluate Improvement Effects