Causal Analysis in Project to achieve Results
Causal Analysis is a project level process which helps us to improve the performance of sub process and/or QPPOs. The intention and the stage in which it’s applied determines whether is proactive causal analysis and Reactive causal analysis. It’s important as an organization we have common guidance on how and when causal analysis techniques can be triggered. Not every root cause analysis is a causal analysis procedure. A root cause analysis could be qualitative or quantitative and it’s a technique to identify the cause which is the root of problem, on the other hand a causal analysis is set of activities formed to achieve desired results by identifying and addressing the causes on systematic manner in addition using quantitative and statistical analysis support.
Causal Analysis can be done in the following conditions,
*Predicted QPPO has shortage in meeting Target QPPO (in terms of certainty or value)
*Critical Sub Process are not performing with stability
*Critical Sub Process are not having Capability
*Actual QPPO values are not meeting the Target QPPO
First bullet talks on “Proactive Causal Analysis” which is performed to ensure that project achieves the results. The rest of the bullets talk on “Reactive Causal Analysis” to ensure the performance is improved from current status. In addition some cases the causal analysis can be triggered to understand the actions which are behind improvement which are noticed, but not planned earlier.
Team Formation:
Considering it’s a technique predominately expected (applying in other functions or group level can be on need basis) to be used in project level, it’s expected to have causal analysis team with identified people. The people can represent various roles in the project team and they understand the project conditions well. It’s also expected that they have undergone training on causal analysis techniques as this will help in achieving better results. The team has to meet on periodical basis to understand conditions, find triggers and monitor the current causal analysis actions. In addition on need basis/milestone basis they can meet to work on causal analysis. The causal analysis team can have process experts also, so that the process point of view causes can be addressed appropriately.
Selection of Outcomes:
As discussed in the trigger the QPPO, Process performance values, X factors are typical outcomes which will be considered in causal analysis. In some cases, where improvement of Sub Process/Process performance will be the outcome to be improved, however it will have positive impact on the QPPO and it might be linked with the Process performance models. So the outcome selected (if its process factor) will have improvement target which is relevant to final QPPO improvement. As an approach a project may start using this formal analysis on selected QPPO and sub process and later expand it to all conditions. However it’s important to remember that this is not an additional activity, but it’s the tool which will improve your QPPO achievement.
Once the outcome areas are selected the problems are defined with improvement to be achieved. The Problem statement shall have clarity in terms of target.
For Example
In our case lets take Defect Density QPPO and in the first module preparation you have got high Values of Defect Density and you have all the relevant data of X factors ( else you would be assuming organizational data to start with), and then you want proactively analyze your defect density outcome and wants to bring it down to below 1.5 Defects/unit in the new module you will be working. We will be using the Process Performance Model to predict, what will be the Defect Density.
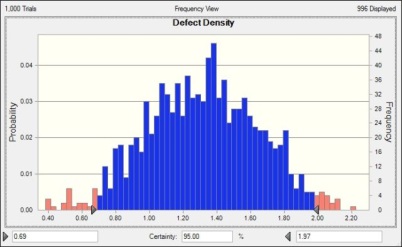
Current values show with the existing process you will be achieving 95% confidence with the upper bound of 1.97 Defect/Unit. You can also move the distribution to the left and take values from 0.
In this case Defect Density is the QPPO, which you want to proactively improve.
However its important to identify the process/sub process which contributes to this outcome and try to bring change in the outcome, as Defect Density may not be directly controlled and it involves number of factors. If we can control Defect Density directly then we don’t need process. So its important to make the problem as process problem to address it.
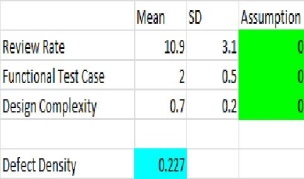
In this case, we assume that Sensitivity Analysis revealed that High Requirements Review Rate as part of Review Process is a contributing factor in our Process Performance Model. In such case the Requirements Review Process and the Review Rate is the controllable factor which we need to monitor and control.
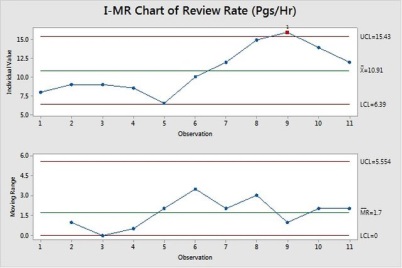
As given in the PPM, the mean is 10.9 and Standard deviation is 3.1, we assume the data is normal (you have to do normality test).
With what value of Review Rate we will be getting 95% certainty of Defect Density at 1.5 Defects/unit, we need find using what if Analysis.
In our case, for example Review Rate Mean is 6 and maintaining standard deviation, we will be getting the Defect Density of 1.5 with 95% certainty (keeping functional test cases, functional design complexity as same). This is an approximate Reduction of 40% on the Review Rate (pages/hour).
Categorize and Perform Root Cause Analysis:
Many a times, it may be more useful to split the outcome in to different category and then perform analysis. This is useful first level analysis and it reduces the effort which we need to put on root cause analysis and reduces complexity. How to come out with new categorization when we don’t have such categorization and data in the format is the typical question. When you don’t have the data most of the time either sampling or reengineering data with categorization for recent period data might be required.
The following table can be used to think on categorizing data,
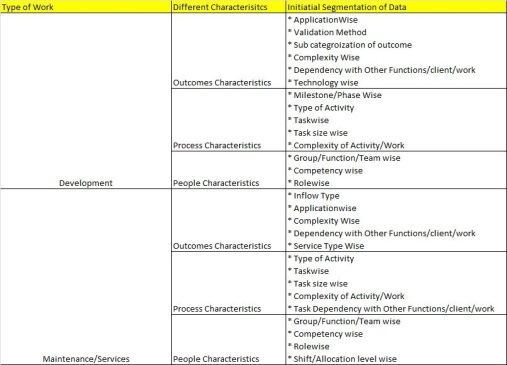
Once we do first level categorization and arrange our existing data in them, it would be easier to study on variation which is happening.
Then we can select specific category of reason/group to understand the root causes behind them in detail with the Causal Analysis team and with selected individuals who are experts in the area. The root causes can be again quantified to see how important it is.
The example given in our case Defect Density and high review rate, we will directly perform the Root cause analysis to find different root causes,
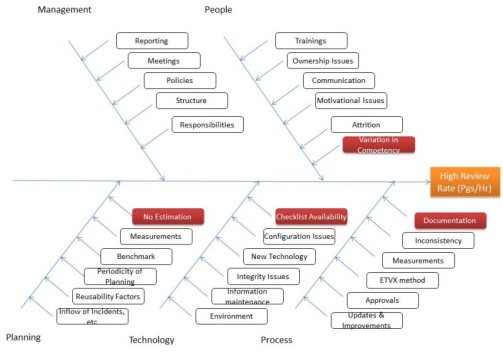
The RCA reveals few causes are key reasons for high review rate, so further we collect the occurrences
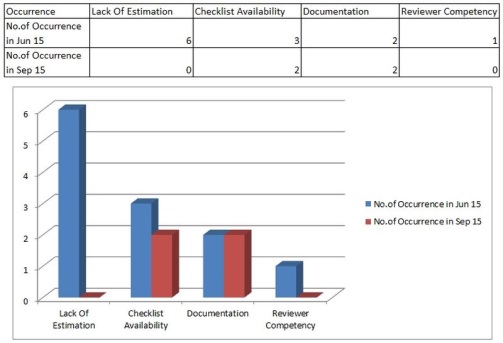
Here just consider the Number of Occurrences for the period of Jun 15 for all the 4 categories and its clear that estimation and checklist are the 2 key reasons (you can use pareto chart).
Identify and Implement Actions:
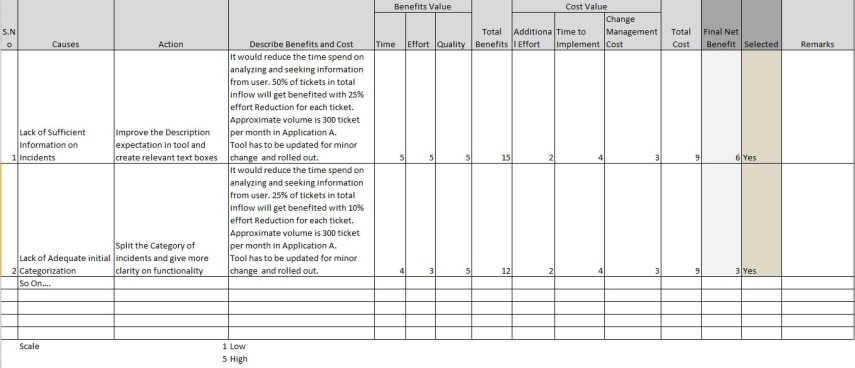
Knowing the root causes and their level of influences on the Performance, we can work on which are the root causes we want to remove /reduce the occurrence. The action items can be identified against them. In addition the actions can be many and not all the actions can be fruitful in delivering the results. Hence its recommended to use cost benefit Analysis or any equivalent technique to see if the actions are useful. There will be no meaning in spending huge cost in improving the performance, where the Returns are lesser than it. Hence its expected to such analysis and then select the actions for implementation.
Usage of PPM is recommended in this case also.
In our case where we already selected the causes the action selection could be listing actions and perform cost benefit analysis.
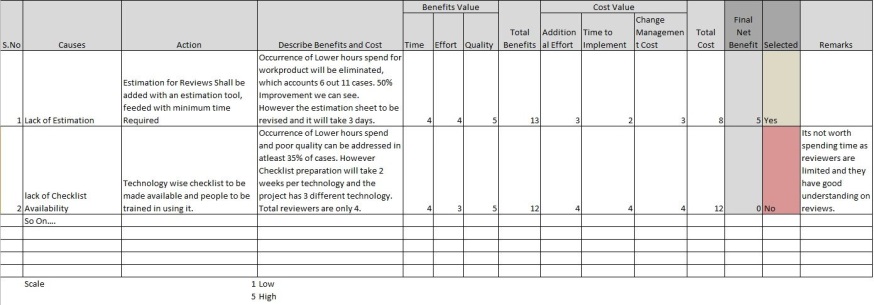
Here we selected actions where the estimation sheets to have standard estimation value for Reviews and adequate effort to be allocated for reviews.
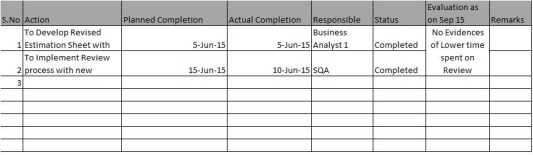
We have also tracked it with relevant monitoring and closed them in sep 15.
Evaluating the Results:
The actions should have resulted in reducing the causes, so in our case if you have seen earlier chart on occurrences for the 4 causes, in sep 15 the values of low estimation has become zero. Hence the actions had impact on arresting the root cause. The next step is to see, whether this condition has helped in overall process performance which we targeted, Hence we have to do before and after comparison of the process performance after actions are completed.
Once we understand there is change in performance, then it has to be statically proven that its significant in achieving the target. Once its proved the control limits/new baseline limits can be achieved. The same can be further used in Process performance models. The cases where the Outcome selected is not limited to stability of Sub process/ Process, its important to see how the results are impacting the QPPO. Hence using the revised control limits/distribution co-ordinates the certainty or target prediction can be done. If the results are not adequate, the relevant actions can be taken.
You can see there is clear drop in estimation causes.
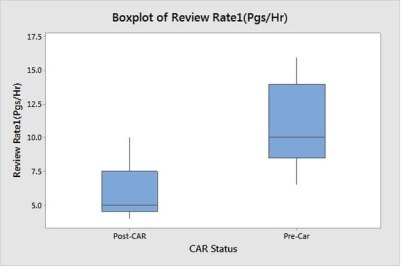
Box Plot shows the mean is significantly reduced, also there is slight change in variance, but doesn’t look signification. Hence we will do Hypothesis test for mean.
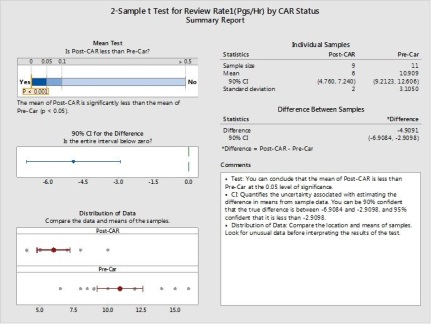
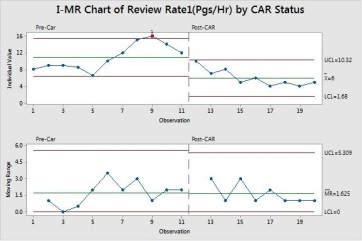
P value is less than 0.05 so we can interpret the performance is significantly changed. So we will revise the control limits with new data after action completion.
With the new values of Review Rate achieved (which approximately equal to the targeted value) , we will what is the actual value of Defect Density in the same period.
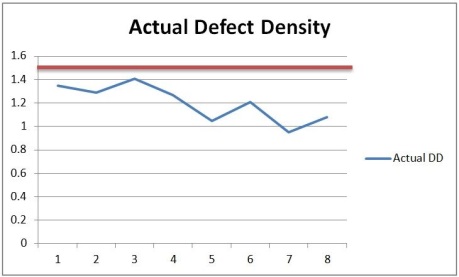
The actual Defect Density is lesser than 1.5.
However its important to see what will happen in the future with current variations, so we use the process performance model with the revised Review rate and other factors as it is and we will run it.
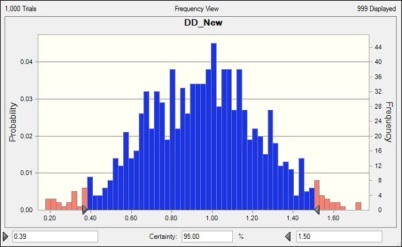
We have got 95% certainty at Defect Density 1.5 Defects/Unit in this case, so we have achieved the results as expected. So we can claim the causal analysis is effective and successful. However in some cases, you may not achieve the exact values as expected, however its still fine.
Example on SLA Compliance:
Assuming we have SLA compliance to improved and the current capability of the X factor Analyze Effort is less as its performing at Mean 103 and SD 26 and we had to make improvement 30% in mean and 60% in SD to achieve an improvement 5% in SLA compliance is the outcome selected. The following is the example charts to see how we might go on addressing them,
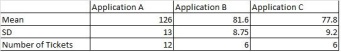
We study the application wise analyze effort to understand if there is variation (refer the table on categorizing) and we found application A is taking more time.
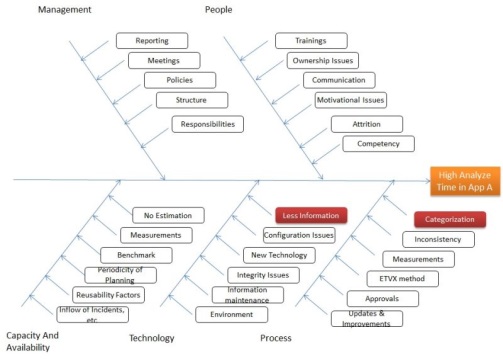
Further Root cause analysis reveals inadequate information for tickets and dependencies create more effort as application has similar functionalities in few areas. We assume the occurrences are 15 times in this category.
Actions are evaluated and the incident tool is added with more details and categorization of incidents for the tickets.
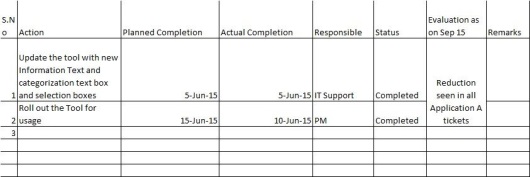
The actions are completed on time.
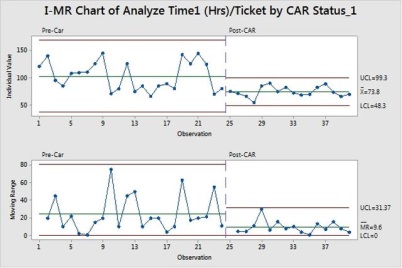
Also we assume the occurrence have reduced to zero and further it has impact in entire set of Application A tickets, so we have to study the performance of Analyze effort for application A. (from below chart its clear there is significant improvement as there is no overlapping region between groups)
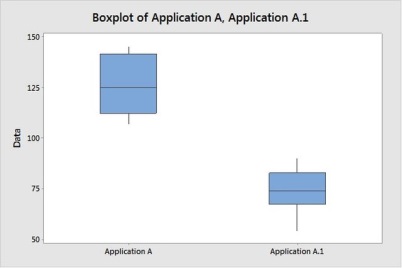
Then we will study change in performance in overall analyze effort,
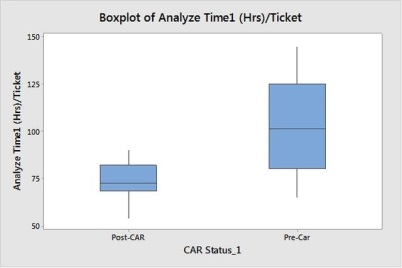
Visually its shows there is difference in mean and in variance,
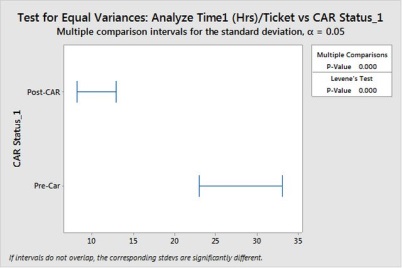
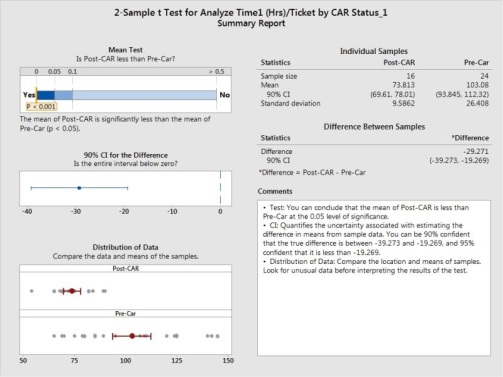
We can see Hypothesis for variance and Mean shows there is significant change. Hence we will revise the control limits,
If we want to study the impact on SLA compliance, we can still use the PPM and run to see the certainty using the new values of Analyze Time.
Causal Analysis Repository and Trigger for Improvements:
The Causal Analysis data has to be submitted to the Software Engineering Process Group to show how the process changes and root cause addressing has resulted in improvement or non improvement. Success and failure both are important to study and understand how the process components have behaved with variation on applications and yielded results. These have to be reviewed and organized as respository by SEPG. They may chose to categorize them in any particular format , which will be easier for projects to select for their case (ex: QPPO wise or Sub process wise or project type wise or technology wise, etc).
Simply uploading a presentation may not be really useful in a repository and hence its recommended to improve the Organization of repository. In addition good causal analysis are a source for identifying improvements which can be deployed across the organization. For example in this case, effort standardization in the template for review to be deployed across the organization. The smaller changes shall be part of SEPG regular Organizational deployment activities and need not be part of Organizational Innovation ideas.
Causal Analysis and Organizational Innovation differs by the reason they are performed as the first one in is mostly to a specific case and localized improvements, and the second one is larger area and covers most of the organizational part. Causal Analysis is a key source for improvement Ideas in the Organizations , however it may not be on the reverse.
What We Covered,
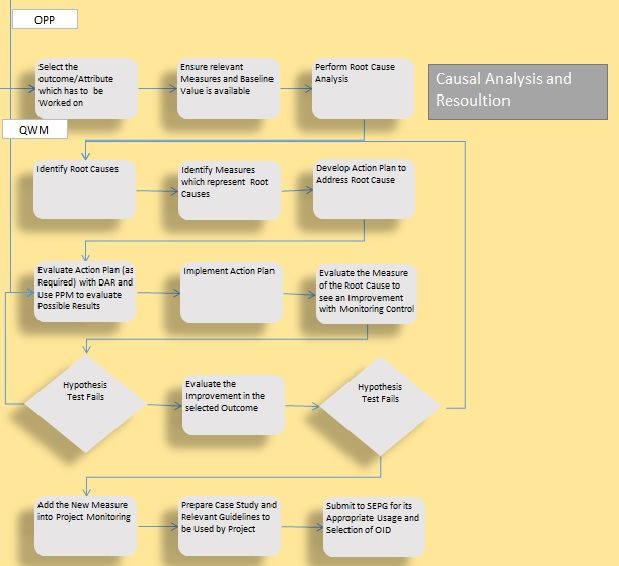
Causal Analysis and Resolution
SG 1 Determine Causes of Selected Outcomes
SP 1.1 Select Outcomes for Analysis
SP 1.2 Analyze Causes
SG 2 Address Causes of Selected Outcomes
SP 2.1 Implement Action Proposals
SP 2.2 Evaluate the Effect of Implemented Actions
SP 2.3 Record Causal Analysis Data