SMART Business Objectives and Aligned Processes
The Ultimate aim of any Business Organization is to earn profit and achieve its business results and CMMI model is aligned to help you achieve the Business results. It provides you the strategic practices which helps you to plan, monitor and manage your business results achievement using Process Improvements. Process here refers to inclusion of people and technology, which means any initiative running to improve people competency or Technological advancement is also considered part of Process Improvement Journey. CMMI sets the expectation clear by asking for measurable business objectives, which includes variation and targeted time. This is achieved by having SMART Business objectives. SMART refers to Specific, Measurable, Attainable, Relevant and Time bound. Which means the objectives to have specific definition, to have clear measure, possible to achieve target, relevant to your business context and it has definite time period.
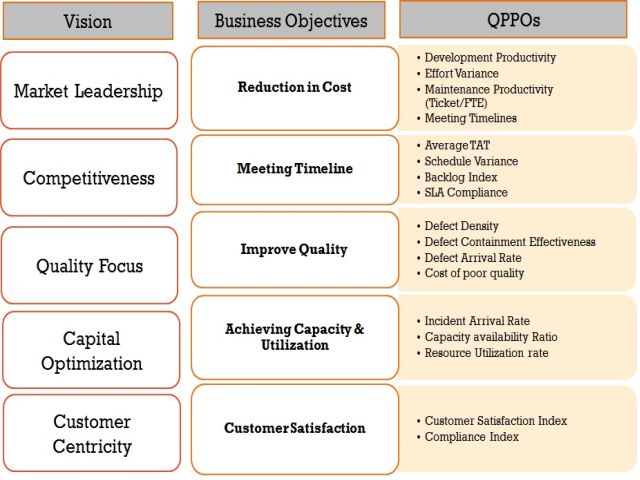
Before we move into explaining it with samples, how do these business objective originate is basically from your vision. Every Business Organization has its vision to achieve and its typically in a few years’ time period. The Vision can only be achieved if your immediate business targets are aligned to it and you keep progress towards them year on year. Hence typically the Business objectives have clear traceability with Vision and it’s of a year or two time period. Vision can get changed when there is a major change in business and market conditions, etc. in such scenario the Business Objectives have to be aligned with it. However it may be uncommon.
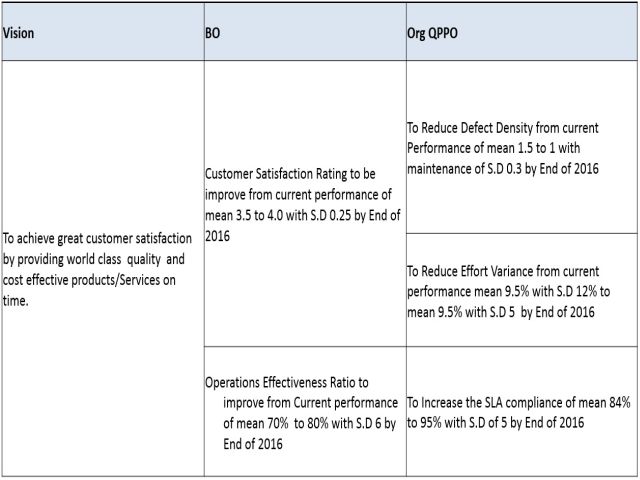
Sample SMART Business Objectives:
*Customer Satisfaction Rating to be improve from current performance of mean 3.5 to new performance mean 4.0 by maintaining Standard Deviation at 0.25 by End of 2016
*Operations Effectiveness Ratio to improve from Current performance of mean 70% to new performance mean 80% by maintaining Standard Deviation 6 by End of 2016
Quality and Process Performance Objectives known as QPPO in CMMI High Maturity is the connecting factor between Processes and Business Objectives of the Organization. They are the objectives which are quality and process targets which are measurable in the lifecycle of Operations/project, which when achieved will lead to business objective achievement. Typically the Business objectives may not be directly measurable from projects or measurable at intermediate stages, which leads to difficulty in controlling them. However QPPOs are intermediate or one of the few important component which influences the final achievement of Business objectives. For example, Customer satisfaction results may be collected in periodic intervals and at the end of project, however what may influence the customer satisfaction is Defect rate in product/service, SLA met, etc. If we keep these quality and process targets in a limit, you may most probably get better customer satisfaction. This is how QPPO works to achieve Business Objectives. The word Quality is stressed to think in terms of Quality Targets in your projects and not only process and cost related targets.
Sample Vision-Business Objectives and QPPOs,
In this Book, We are going to use two sample cases of Business Objectives and QPPO’s throughout, as applicable. One Business Objective from Application Development and another from Application maintenance Scenario. So for the Business Objective sample which we saw in last section, the following could be the QPPOs,
BO-QPPO Relationship
The relationship has to be logically identified with group of relevant people. Then they can be weighted across multiple QPPOs. The QPPO which is possible to collect and contribute to one or more Business Objective and critical in nature is prioritized and selected. There can be many possible QPPO’s contributing to given Business objectives, however the Organization has to do trade off to find the best possible ones , so that cost of measuring and Predicting these QPPOs has good Return on Investments(ROI).
Though we may start with simple logical relationship, we need to establish a quantitative/statistical relationship of QPPO with BO to find it an effective tool to achieve the Business Objective. So if the data available already then these relationships to be established early.
In the above sample given here, if we collected the data from various projects and the metrics are available with us, we may plot them to understand the relationship to substantiate their logical relationship.
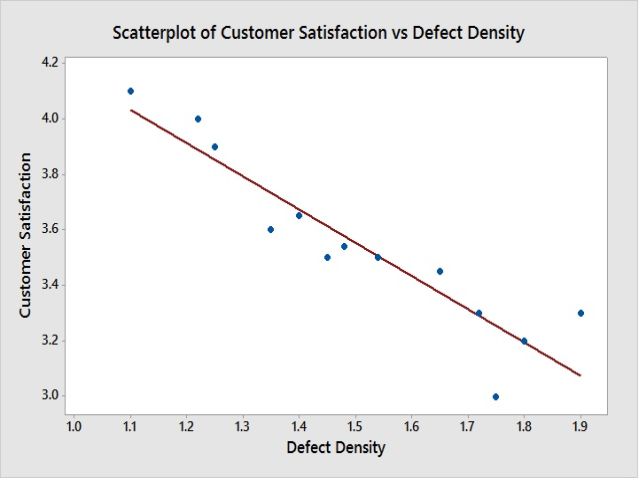
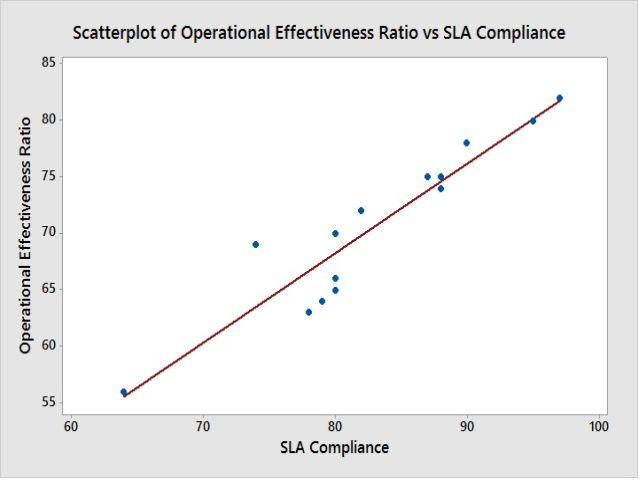
When it’s not possible to get this level of detail at the beginning of your journey for all Business objectives and QPPOs, you are expected to collect data and to build it. The relationship need not be always linear in nature and also it can be mathematical relationship in some cases.
Once we understand the possible QPPO’s we need to evaluate them on selecting for future usage. Though some of them could good measures for BO, they may not be easy and periodical to capture and analyse. Some of them has influence of similar other QPPO’s and so on. Hence it’s expected to evaluate the Business Benefit in selecting the QPPO along with their relationship with BOs.
A sample QPPO table is given below,
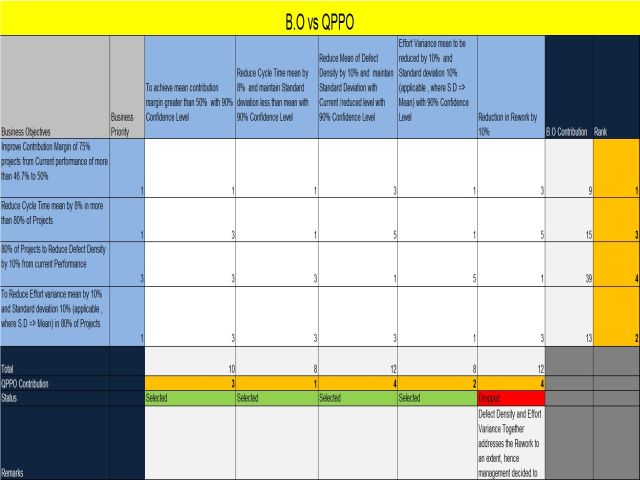
Business Priority
1 -High, 3-Medium, 5-Low
QPPO Correlation with B.O
1-High, 3 - Medium, 5- Low
QPPO Contribution field is ranked based on their contribution, and lower the value then more chance of getting selected. However you may reject few QPPOs based on business and practical reasons, however it should be a well thought out decision. Also the ranking of QPPO helps in sub optimization and which one to give high importance.
Process Flow and Process/Sub Process Selection:
Once the QPPO’s are selected the next important step is to understand how the process system helps us to achieve these QPPO’s and which Process and Sub Processes are critical and what factors to consider and what measures to consider. Hence its important for us to have Process System Map with us, before getting in to this step.
In our sample case, we are considering we have QPPO’s on Software Application Development and Software Application Management/maintenance Lifecycles. Hence its important for us to Identify the Processes and its Sub Process ( it could be a logical group of set of activities already defined in process) and their configuration as part of Delivery. So it would be easier for us to understand how the Process/Sub Process contributes to Business.
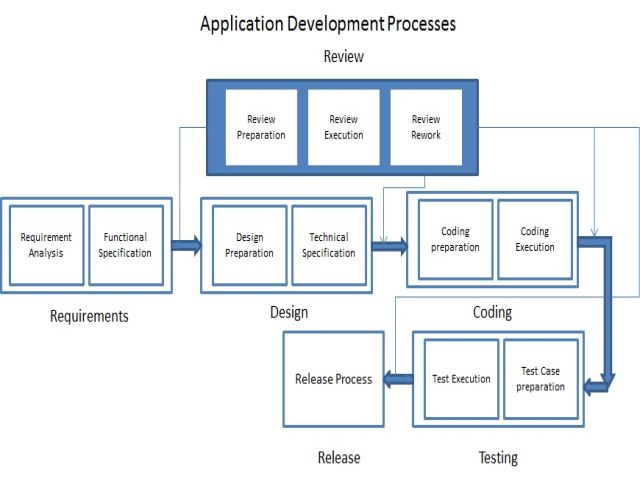
Here we can see the Release Process is not broken in to Sub Process but all other Processes are now identified in terms of their Sub Process. Hence further analysis and attribute identification, etc will be handled using these set of Process/Sub Process for the QPPO and Application Development Area.
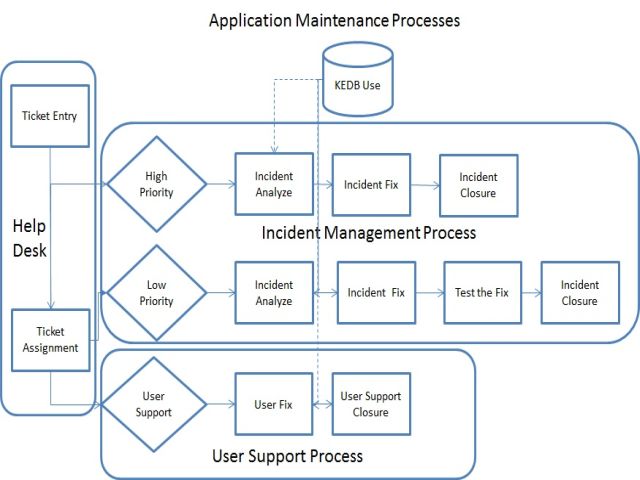
Here Help Desk as a function performs certain action in assigning tickets to the Project team. However the Incident Management Process is broken in to Sub Process and User Support Process also divided in to Sub Process. It’s not necessary that every Process has to be split in to Sub Process. The Selection of Sub Process is based on criticality, measurability, and logical relationship, interaction points with other Process and Roles and Tools involved. Based on this we may choose to form sub processes in a given process, as it’s not always denoted in the past in a new High Maturity Seeking Organizations.
Once the Sub Process is identified, it’s important to see what attributes of the Sub Process will be useful in prediction and Controlling the final Results (QPPO). Also which attributes are controllable or possible to monitor with thresholds. Based on existing process architecture and Logical Discussions the Process and their contribution to QPPO with Measurable Attributes can be identified. Logically we may first want to know the Quality, Cost, and Time Parameters of Sub Process and then find measures which will be able to communicate the performance of them. For example in our case we have taken Defect Density as QPPO, which means the Process/Sub Process which contributes to Defect Injection and Defect Detection has to be selected for measuring and measures of Defect (direct measure) achieved through the process and measures which rule the efficiency of those process (time spent, effort spent- Indirect measure) will be our interest. Hence these has to be identified as Process Attributes to measure.
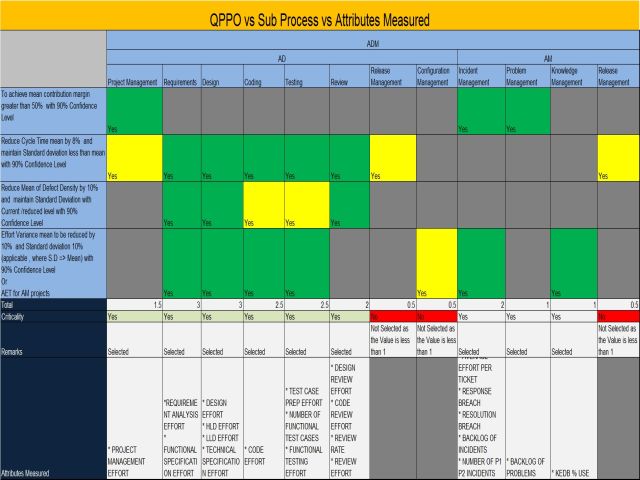
Values:
Yes with Logical & Statistical Relationship 1, Yes with Only Logical Relationship 0.5, No/NA 0
Selection Criteria:
At least 1 goal the Sub process should contribute and its overall value to be 1 or greater than that.
These are the Process and Sub Process Measures which will be helping us to understand and monitor the QPPOs and by controlling these measures it would be possible to manage the results of identified QPPOs. Having said that there could be many influencing factors a Process or process system have, which can impact achievement of these sub process measures and QPPOs. Identification of these measures are always tricky as it could be any factors pertaining to the lifecycle. Good brainstorming, root cause analysis or why-Why techniques may reveal what are the underlying causes which influence the results. These are probably the influencing factors which we may want to control to achieve results at process level or even at QPPO Level.
In order to help us understand that, these factors are coming from multiple areas, the following X factor selection matrix can help.
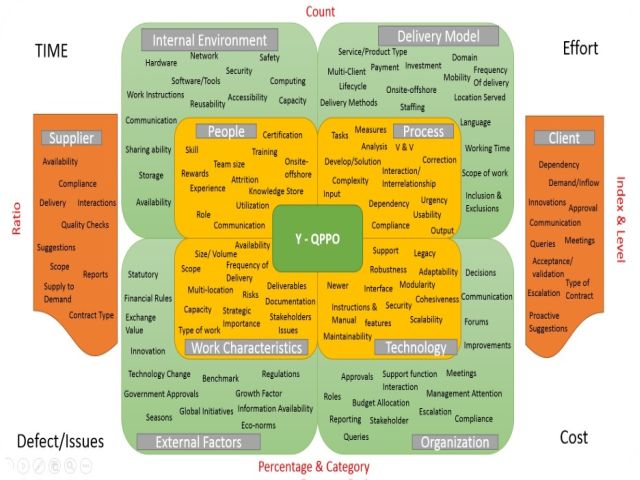
Identifying the X factor which influences Y Factor (QPPO’s) is performed logically first and then data collected about these measures. The relationship is established between the X factors and Y factors. These relationship can also be used as Process Performance Model, when it meets the expectation of PPM. Which means not all statistical or probabilistic relationship will be used as PPM, however its necessary to qualify a factor as X factor. We will see further details about PPM in the upcoming chapters.
What We Covered:
Organizational Process Performance:
SP 1.1 Establish Quality and Process Performance Objectives
SP 1.2 Select Processes
SP 1.3 Establish Process Performance Measures