4 Graphics and Visualisation
There are many ways in which to plot data. It is very difficult to write graphics applications in F95, so generally it is easier (and better) to use an application. One such application is gnuplot, which is a free plotting program that can plot data files and user-defined functions. It can’t do everything you might possibly want, but it is very easy to use. We introduce gnuplot here – there is documentation available via ‘help’ within the program and on the course web site.
gnuplot is a command-line driven program. Typing gnuplot at the terminal you will see that the prompt changes. You will want to use the help command to find out more information. You will also be able to output graphs from gnuplot in a form you can import into, say, Microsoft Word, when you produce your report.
4.1 Plotting a data file
gnuplot expects data to be arranged in columns in an ordinary text file, e.g.
# Gnu population in Antarctica since 1965
1965 103
1970 55
1975 34
1980 24
1985 10
You can have as many columns as you like. Comments are indicated by ‘#’. The recommended way you use gnuplot to produce results from your F95 program is therefore to write out results to a file and use gnuplot to plot them. Let’s look at a simple F95 program to do just that.
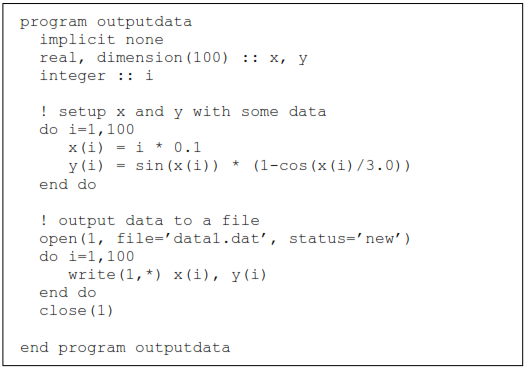
The file data1.dat should contain the two columns of numbers, exactly the format needed by gnuplot. To plot the data is very easy:
plot ’data1.dat’
4.2 Getting help
You can get help by typing ‘?’ or ‘help’ within gnuplot. The on-line help is very good. You can also abbreviate commands to save typing.
4.3 Further examples
As well as plotting data we can plot functions in gnuplot.
sin(x)*cos(x)
pop(x) = sin(x)*(1-cos(x/3.0))
plot [0:10] pop(x)
plot ’data1.dat’
plot [0:10] ’data1.dat’, pop(x)
plot ’data1.dat’ with linesp
plot ’data1.dat’ w lines
plot [0:10] ’data1.dat’ w lines 2 2, pop(x) \
w lines 1 1
plot ’flib.dat’ u 2:4 w linesp
plot ’flib.dat’ u 2:4:5:6 w errorbars
4.4 Printing graphs into PostScript files
set term post
set output ’file.ps’
replot
set term X
before plotting to the file. This reduces the size of the graph while keeping the font size and point size constant.
There are other output types from gnuplot. In particular you may want to use the CGM terminal type instead of the PostScript terminal type as above (use cgm instead of post). This produces a file which can be read directly into Microsoft Word and converted to a Word drawing.