CHAPTER
PROFILING WITH CPROFILE AND LINE_PROFILER
The profile module is the standard way to profile Python code, take a look at it here http://docs.python.org/library/profile.html. We’ll run it on our simple Python implementation:
>> python -m cProfile -o rep.prof pure_python.py 1000 1000
This generates a rep.prof output file containing the profiling results, we can now load this into the pstats module and print out the top 10 slowest functions:
>>>importpstats
>>> p=pstats.Stats(’rep.prof’)
>>> p.sort_stats(’cumulative’).print_stats(10)
Fri Jun 24 17:13:11 2011 rep.prof
51923594 function calls (51923523 primitive calls) in 54.333 seconds
Ordered by: cumulative time
List reduced from 558 to 10 due to restriction <10>
ncalls tottime percall cumtime percall filename:lineno(function)
1 0.017 0.017 54.335 54.335 pure_python.py:1(<module>)
1 0.268 0.268 54.318 54.318 pure_python.py:28(calc_pure_python)
1 37.564 37.564 53.673 53.673 pure_python.py:10(calculate_z_serial_purepython)
51414419 12.131 0.000 12.131 0.000 {abs}
250069 3.978 0.000 3.978 0.000 {range}
1 0.005 0.005 0.172 0.172 .../numpy/__init__.py:106(<module>)
1 0.001 0.001 0.129 0.129 .../numpy/add_newdocs.py:9(<module>)
1 0.004 0.004 0.116 0.116 .../numpy/lib/__init__.py:1(<module>)
1 0.001 0.001 0.071 0.071 .../numpy/lib/type_check.py:3(<module>)
1 0.013 0.013 0.070 0.070 .../numpy/core/__init__.py:2(<module>)
Take a look at the profile module’s Python page for details. Basically the above tells us that calculate_z_serial_purepython is run once, costs 37 seconds for its own lines of code and in total (in- cluding the other functions it calls) costs a total of 53 seconds. This is obviously our bottleneck.
We can also see that abs is called 51,414,419 times, each call costs a tiny fraction of a second but 54 million add up to 12 seconds.
The final lines of the profile relate to numpy - this is the numerical library I’ve used to convert the Python lists into a PIL-compatible RGB string for visualisation (so you need PIL and numpy installed).
For more complex programs the output becomes hard to understand. runsnake is a great tool to visualise the profiled results:
>> runsnake rep.prof
This generates a display like:
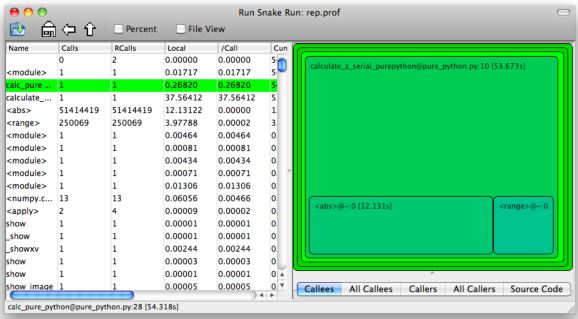
Figure 8.1: RunSnakeRun’s output on pure_python.py
Now we can visually see where the time is spent. I use this to identify which functions are worth dealing with first of all - this tool really comes into its own when you have a complex project with many modules.
However - which lines are causing our code to run slow? This is the more interesting question and cProfile can’t answer it.
Let’s look at the line_profer module. First we have to decorate our chosen function with @profile:
@profile
def calculate_z_serial_purepython(q, maxiter, z):
Next we’ll run kernprof.py and ask it to do line-by-line profiling and to give us a visual output, then we tell it what to profile. Note that we’re running a much smaller problem as line-by-line profiling takes ages:
>> kernprof.py -l -v pure_python.py 300 100
File: pure_python.py
Function: calculate_z_serial_purepython at line 9
Total time: 354.689 s
Line # Hits Time Per Hit % Time Line Contents
==============================================================
9 @profile
10 def calculate_z_serial_purepython(q, maxiter, z):
11 """Pure python with complex datatype, iterating over
12 1 2148 2148.0 0.0 output = [0] * len(q)
13 250001 534376 2.1 0.2 for i in range(len(q)):
14 250000 550484 2.2 0.2 if i % 1000 == 0:
15 # print out some progress info since it is
16 250 27437 109.7 0.0 print "%0.2f%% complete" % (1.0/len(q)
17 51464485 101906246 2.0 28.7 for iteration in range(maxiter):
18 51414419 131859660 2.6 37.2 z[i] = z[i]* z[i] + q[i]
19 51414419 116852418 2.3 32.9 if abs(z[i]) > 2.0:
20 199934 429692 2.1 0.1 output[i] = iteration
21 199934 2526311 12.6 0.7 break
22 1 9 9.0 0.0 return output
Here we can see that the bulk of the time is spent in the for iteration in range(maxiter): loop. If the z[i] = z[i] * z[i] + q[i] and if abs(z[i]) > 2.0: lines ran faster then the entire function would run much faster.
This is the easiest way to identify which lines are causing you the biggest problems. Now you can focus on fixing the bottleneck rather than guessing at which lines might be slow!
REMEMBER to remove the @profile decorator when you’re done with kernprof.py else Python will throw an exception (it won’t recognise @profile outside of kernprof.py).
As a side note - the profiling approaches shown here work well for non-CPU bound tasks too. I’ve successfully profiled a bottle.py web server, it helps to identify anywhere where things are running slowly (e.g. slow file access or too many SQL statements).