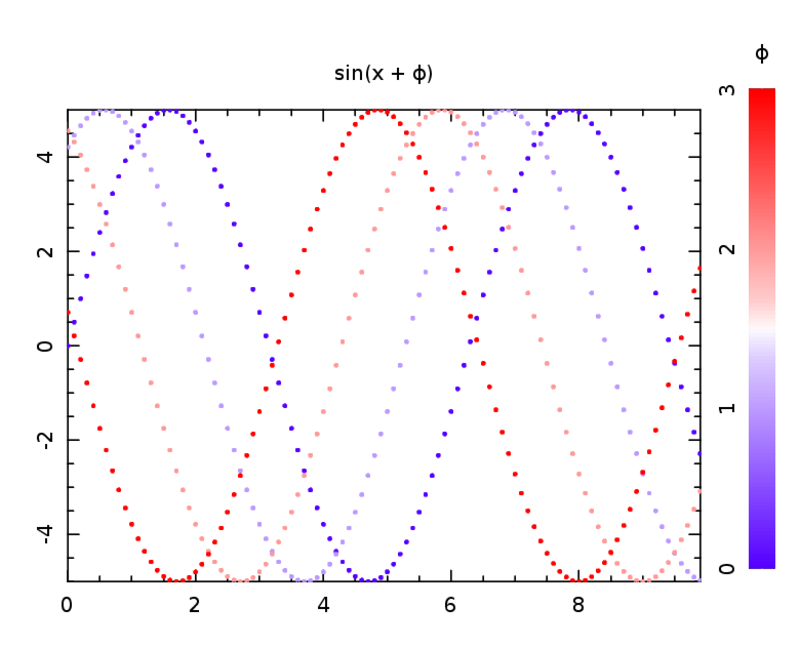
FILE => 'Multidimensional2.eps');
# Generate a time series and phase offset
my $time = sequence(100)/10;
my $phi = zeroes(4)->xlinvals(0, 3)->transpose;
my $sinewaves = 5*sin($time + $phi);
# Plot the time series and phi color key
$pl->xyplot($time, $sinewaves,
PLOTTYPE => 'POINTS',
COLORMAP => $phi,
TITLE => 'sin(x + #gf)');
$pl->colorkey($phi, 'v',
TITLE => '#gf',
VIEWPORT => [0.93, 0.96, 0.15, 0.85]);
$pl->close;
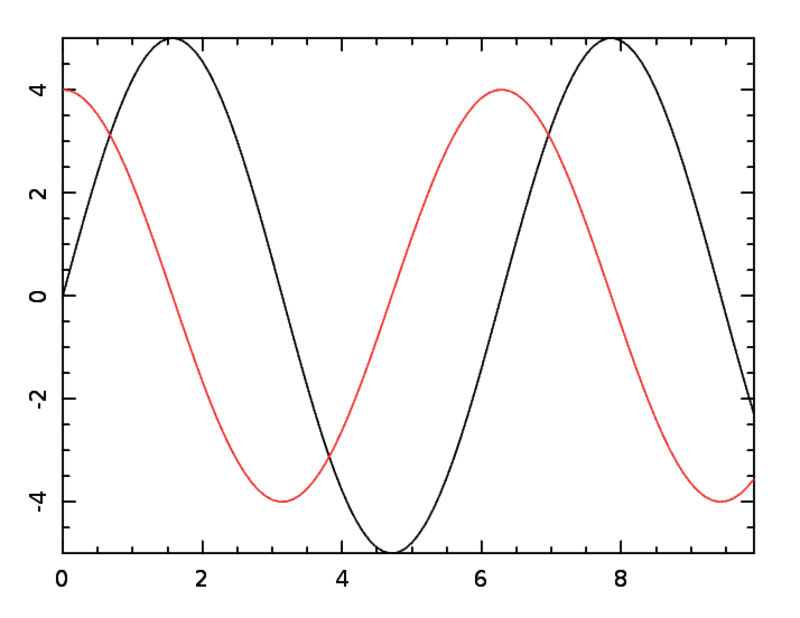
Plotting multiple curves with differently colored calls to xyplot
An alternative to plotting a multi-dimensional piddle, you can plot multiple curves by multiple calls to xyplot, specifying a different color for each plot.
Legal colors are:
BLACK GREEN WHEAT
BLUE RED AQUAMARINE
GREY BLUEVIOLET YELLOW
PINK BROWN CYAN
TURQUOISE MAGENTA SALMON
WHITE ROYALBLUE DEEPSKYBLUE
VIOLET STEELBLUE1 DEEPPINK
MAGENTA DARKORCHID1 PALEVIOLETRED2
TURQUOISE1 LIGHTSEAGREEN SKYBLUE
FORESTGREEN CHARTREUSE3 GOLD2
SIENNA1 CORAL HOTPINK
LIGHTCORAL LIGHTPINK1 LIGHTGOLDENROD
Notes:
-- Curve clipping - the first plot sets the plotting boundaries
and later plots fall outside of those boundaries
-- Changing `current' color - the first plot sets the `current'
color and the second does not specify a color
-- PLplots has a discrete color limit of 16, including foreground and background color.
When plotting multiple curves, the first plot sets the boundaries, and can result in subsequent plots being clipped. The obvious solution, is to plot your curve with largest values first. To force a separate color from the first set default color, always specify the colors in xyplot.
A multiple curve with xyplot
#!/usr/bin/perl
use strict;
use warnings;
use PDL;
use aliased 'PDL::Graphics::PLplot';
# Generate a time series
my $time = sequence(100)/10;
my $sinewave = 5 * sin($time);
my $cosinewave = 4 * cos($time);
# Save the image to a postscript file
my $pl = PLplot->new(
DEV => 'pscairo',
FILE => 'Multiple curves.eps'
);
# Plot the sine in black, cosine in red
$pl->xyplot($time, $sinewave);
$pl->xyplot($time, $cosinewave , COLOR => 'RED');
$pl->close;
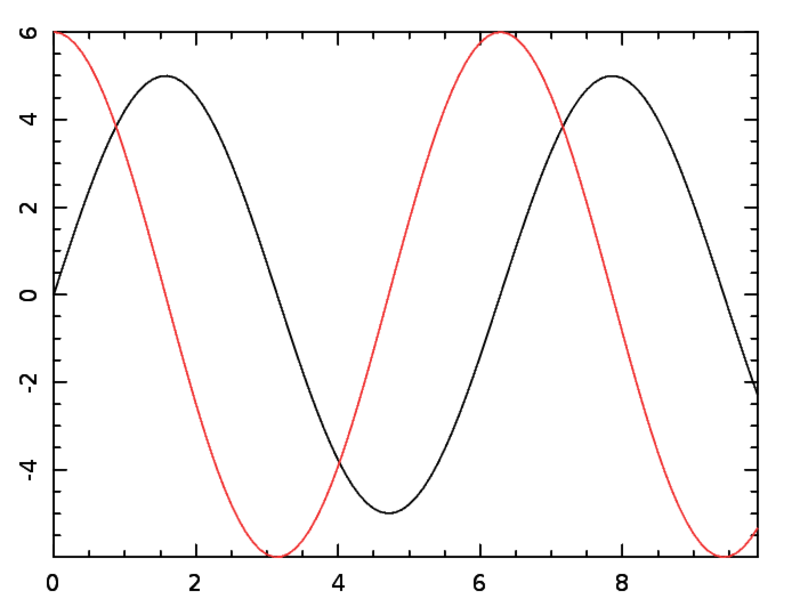
Solving curve clipping on multiple xyplots with the BOX option
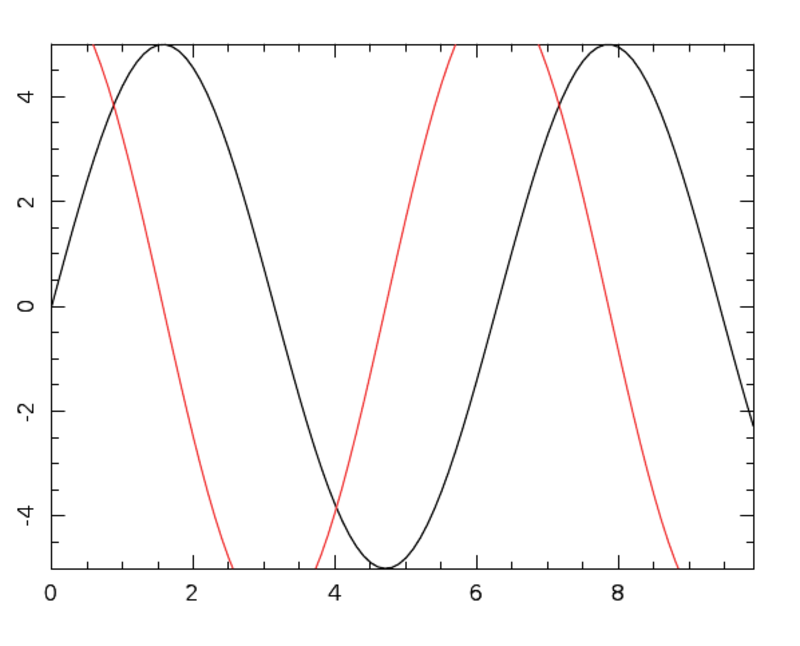
When you have multiple xyplots, with widely separated values, you can use the xyplot BOX option to prevent clipping.
#!/usr/bin/perl
use strict;
use warnings;
use PDL;
use aliased 'PDL::Graphics::PLplot';
# Generate a time series
my $time = sequence(100)/10;
my $sinewave = 5 * sin($time);
my $cosinewave = 6 * cos($time);
# Save the image to a postscript file
my $pl = PLplot->new(
DEV => 'pscairo',
FILE => 'Multiple curves3.eps'
);
# Plot the sine with full bounds
$pl->xyplot($time, $sinewave,
BOX => [$time->minmax, $cosinewave->minmax]);
# Plot the cosine in red
$pl->xyplot($time, $cosinewave , COLOR => 'RED');
$pl->close;
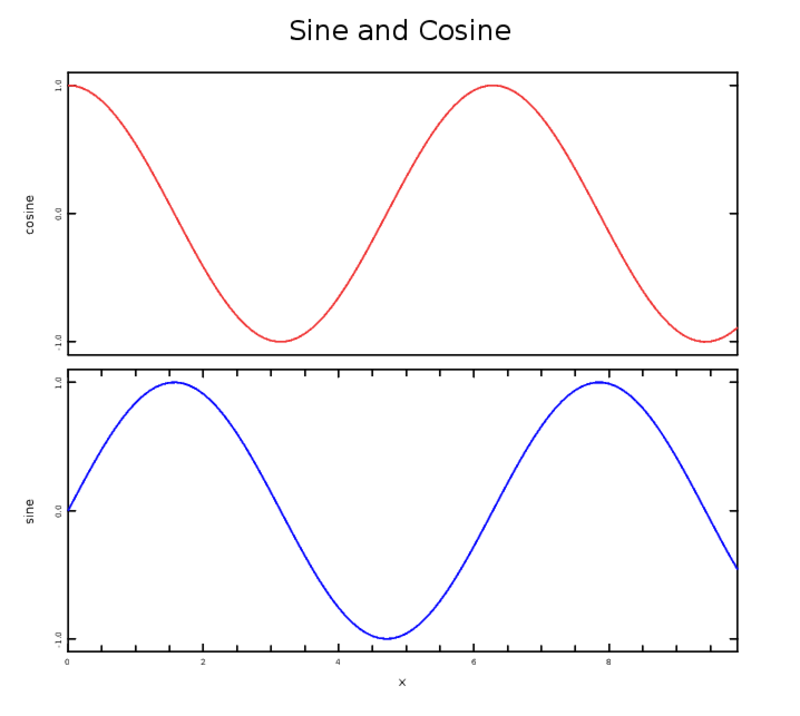
Plotting multiple curves with stripplot
#!/usr/bin/perl
use strict;
use warnings;
use PDL;
use aliased 'PDL::Graphics::PLplot';
# Save the image to a postscript file
my $pl = PLplot->new(
DEV => 'pscairo',
FILE => 'stripplots.eps'
);
# Generate a time series
my $time = sequence(100)/10;
# Make stripplots with the
# different time series
$pl->stripplots($time,
[sin($time), cos($time)],
XLAB => 'x',
YLAB => ['sine', 'cosine'],
COLOR => ['BLUE', 'RED'],
TITLE => 'Sine and Cosine'
);
$pl->close;
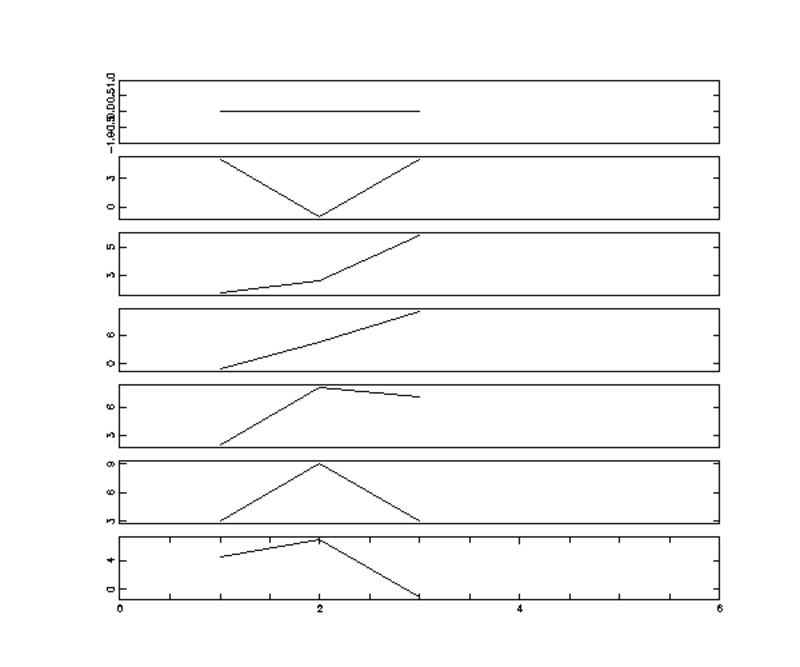
Stripplots and reading DATA with rcols
#!/usr/bin/perl
use strict;
use warnings;
use PDL;
use PDL::Graphics::PLplot;
my ($t, $data) = rcols(*DATA, 0, []);
my $pl = PDL::Graphics::PLplot->new( DEV => "xwin" );
# Make stripplots with the different time series
# notice data must be transposed
$pl->stripplots($t, $data->transpose);
$pl->close;
__DATA__
# t x1 x2 x3
1 4 6 -1
2 3 9 3
3 2 8 7
3 -1 4 10
5 1 2 6
6 5 -1 5
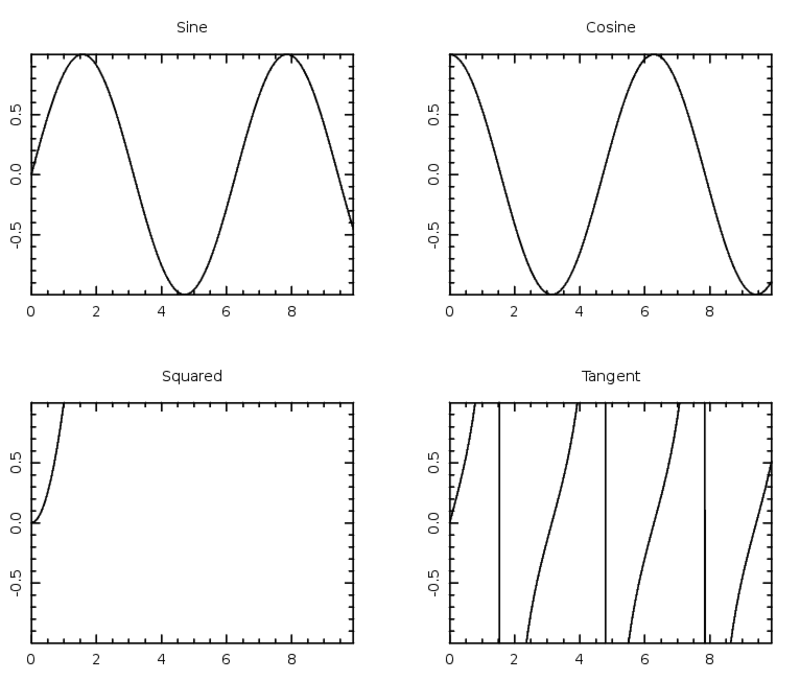
Multiple plots with SUBPAGE
When you create your PLplot object, you can carve the canvas into immutable subpages. my $pl = PDL::Graphics::PLplot->new( # ... , SUBPAGES => [$nx, $ny] );
For example:
#!/usr/bin/perl
use strict;
use warnings;
use PDL;
use aliased 'PDL::Graphics::PLplot';
# Generate a time series
my $time = sequence(100)/10;
# Save the image to a postscript file
my $pl = PLplot->new(
DEV => 'pscairo',
FILE => 'subpages.eps',
SUBPAGES => [2,2]);
# Plot the time series
$pl->xyplot($time, sin($time), TITLE => 'Sine');
$pl->xyplot($time, cos($time), TITLE => 'Cosine',
SUBPAGE => 0);
$pl->xyplot($time, tan($time), TITLE => 'Tangent',
SUBPAGE => 4);
$pl->xyplot($time, $time**2, TITLE => 'Squared',
SUBPAGE => 3);
$pl->close;
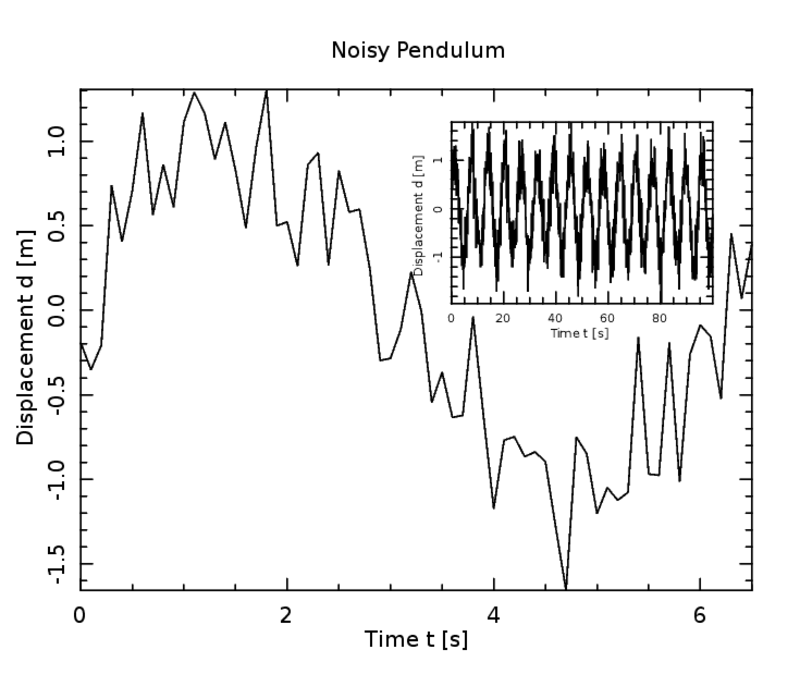
Boxes and Viewports
Using Insets
Sometimes you want a small inset in one of the corners of your plot. If you ant to do this you should:
-- Specify the VIEWPORT
-- Specify the BOX
-- Use a smaller CHARSIZE
-- If the underlying plot has a title, you should probably undefine it
-- Undefine or change the XLAB and YLAB unless you want to use the
values from the underlying plot
#!/usr/bin/perl
use strict;
use warnings;
use PDL::Graphics::PLplot;
use PDL;
use PDL::NiceSlice;
# Generate a noisy time series
my $time = sequence(1000) /10;
my $sinewave = 1 * sin($time) + grandom($time) / 3;
# Save the image to a postscript file
my $pl = PDL::Graphics::PLplot->new( DEV => 'pscairo', FILE =>
'inset.eps');
# Plot subset as the main plot
$pl->xyplot($time(0:65), $sinewave(0:65), TITLE => 'Noisy Pendulum',
YLAB => 'Displacement d [m]', XLAB => 'Time t [s]');
# Plot full data set as inset
$pl->xyplot($time, $sinewave,
TITLE => undef,
VIEWPORT => [0.525, 0.825, 0.525, 0.775],
BOX => [$time->minmax, $sinewave->minmax],
CHARSIZE => 0.6
);
$pl->close;
Basics of viewports
PLplot has three distinct measurements for your plot at any point:
-- the plotting surface's dimensions
-- the viewport's relative extent
-- the `natural' coordinates within the viewport
Surface dimensions
The dimensions of the canvas or surface that you are using can be specified in the constructor (and cannot be changed later):
my $pl = PDL::Graphics::PLplot->new(
# other options...
PAGESIZE => [$width, $height]
# other options...
);
These are measured either in pixels or milimeters depending on whether the underlying format is a raster or vector format.
Viewport positioning
The viewport carves out a chunk of space on the canvas for plotting and can be changed with each plotting function.
$pl->xyplot($x, $y
# other options
, VIEWPORT => [$xmin, $xmax, $ymin, $ymax]
# other options
);
# Plot on right half of the page
VIEWPORT => [0.5, 1, 0, 1]
# Plot in upper half of the page
VIEWPORT => [0, 1, 0, 0.5]
# Vertically centered, horizontally offset
VIEWPORT => [0.5, 0.7, 0.4, 0.6]
Viewport values are fractions of the full page (or sub-page) width all four values should be a number between 0 and 1.
The clipping box
If the viewport indicates the chunk of space you will be graphing on, the clipping box indicates the coordinates within that chunk of space.
$pl->xyplot($x, $y
# other options...
, BOX => [$xmin, $xmax, $ymin, $ymax]
# other options...
);
# x runs from 0 to 10, y from -8 to 8:
BOX => [0, 10, -8, 8]
# piddles have the minmax method:
BOX => [$x pdl->minmax, $y pdl->minmax]
When plotting using the specified box, a data point near (0, -8) will be plotted near the lower left corner and a data point near (5, 0) will be plotted at the center. Viewports define where plots are drawn. Tick labels, axis labels, and plot titles are drawn outside the viewport.
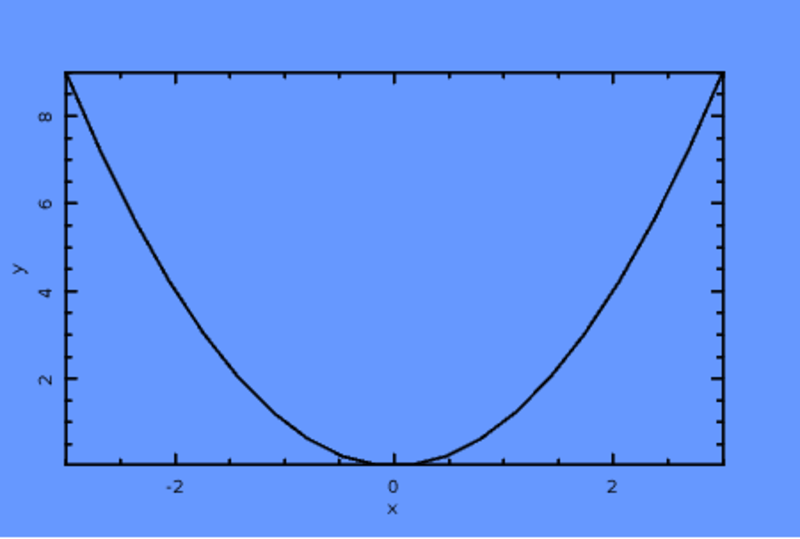
Page size
#!/usr/bin/perl
use strict;
use warnings;
use PDL;
use aliased 'PDL::Graphics::PLplot';
my $x = zeroes(20)->xlinvals(-3, 3);
my $y = $x**2;
# Set a custom page size
my $pl = PLplot->new(
DEV => 'pscairo',
FILE => 'box example 2.eps',
BACKGROUND => 'SKYBLUE',
PAGESIZE => [360, 240]
);
# Plot a quadratic function:
$pl->xyplot($x, $y, YLAB => 'y', XLAB => 'x');
$pl->close
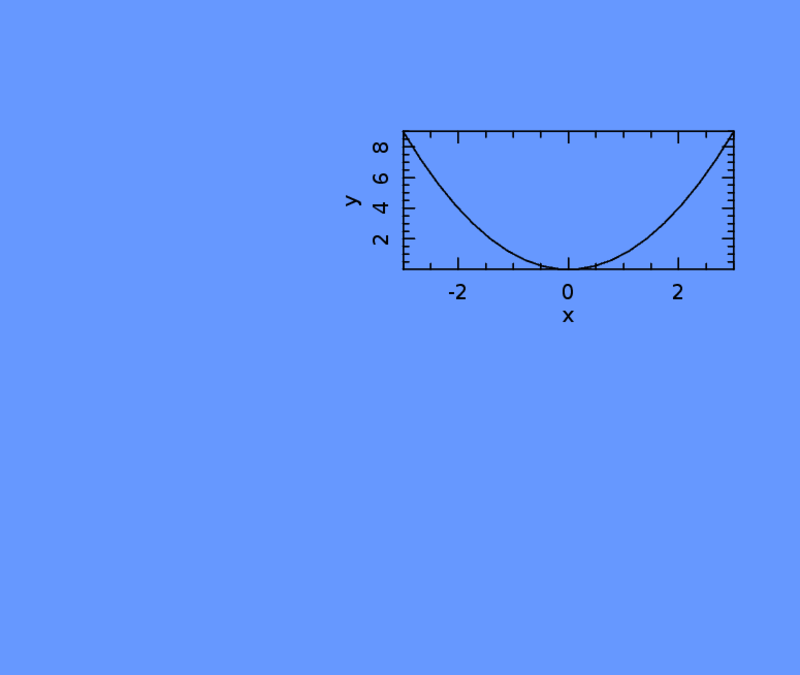
Viewport upper right
#!/usr/bin/perl
use strict;
use warnings;
use PDL;
use aliased 'PDL::Graphics::PLplot';
my $x = zeroes(20)->xlinvals(-3, 3);
my $y = $x**2;
my $pl = PLplot->new(
DEV => 'pscairo',
FILE => 'box example 3.eps',
BACKGROUND => 'SKYBLUE'
);
# Put the plot in the upper right:
$pl->xyplot($x, $y,
YLAB => 'y',
XLAB => 'x',
VIEWPORT => [0.5, 0.9, 0.6, 0.8]
);
$pl->close;
Viewport centered
#!/usr/bin/perl
use strict;
use warnings;
use PDL;
use aliased 'PDL::Graphics::PLplot';