Section 3
Bearish Reversal System Case Studies
This is the system that I played most, the holding period is shorter and the profits are quicker. However, since the returns are greater and so are the risks because it involved the purchase of a straight put which is exposed to Time Decay and the Implied Volatility of the option. You must enforce strict risk management rules to protect and to preserve your capital as top priority.
I have been using and have taught my students to use conditional orders to minimize trading emotions and not to miss out on any trading opportunities that are available.
Conditional orders reduces emotional trading
A conditional order is a type of order that will be submitted or canceled if set criteria are met, which are set by the trader before entering the order. There is no doubt that emotions can be your worst enemy when you trade. Conditional order can help to reduce stress and emotions while trading.
Very often you missed a trading opportunity simply because you hesitated too long or watched your profits disappear when you become greedy to hang on for more profits, instead of sticking to your trading plan.
This allows for a greater customization of the order to meet the specific needs of the investor hence reducing emotional trading. The order just filled by itself when the conditions are fulfilled.
Eliminating the fear of missing opportunities
Many occasions trading opportunities are missed just because you wasn’t at you computer staring at the chart when the entry signal was present. Conditional orders are used to place your orders before the market opens; defining a trigger price for your order makes you detachable from your computer.
Thanks to the advance trading platform available, trading has never been much easier. These automatic features allow you to separate trading from constant monitoring of the market, which is maintained even when you are away from your desk so you can have more freedom to do other things.
"Chance favors the prepared mind" – Louis Pasteur
Trading using conditional orders
Let me show you a classic example of how I used conditional orders to eliminate the abovementioned problems and profiting from it.
During the Chinese New Year, I want to detach myself from the markets so as to enjoy the celebrations. As a trader it is important to know when to take a break from trading if deem necessary.
The markets will always be there and there is no need to rush. Traders who can’t just stop trading for even one day are addicted and if it is uncontrollable, it could be dangerous. Just like gambling.
After about a week absent from trading options I decided to do some screening and there were 13 possible counters to play.
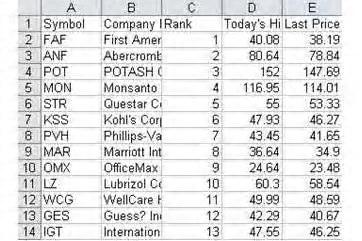
After going through the charts and the IV index, comparing the options premium and the slippage, only three were short listed. There were STR, KSS and PVH and the trading plan was set up.
Trading Plan for STR
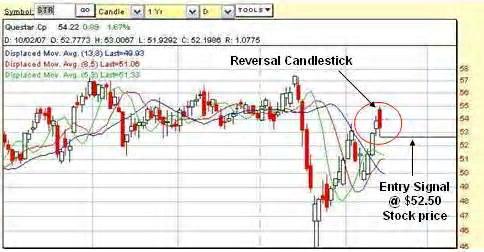
Stock trading at $53.33 and when stock price is below $52.50, buy Apr 08 $50 Put.
Trading Plan for KSS
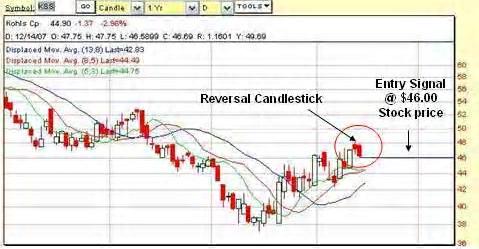
Stock trading at $46.27 and when stock price is below $46.00, buy Apr 08 $45 Put.
Trading Plan for PVH
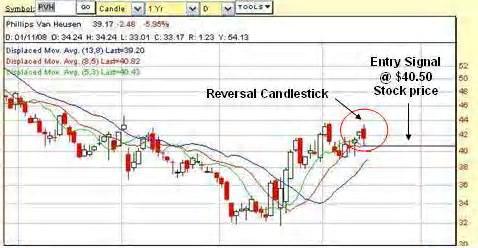
Stock trading at $41.65 and when stock price is below $40.50, buy Jun 08 $40 Put.
In the Asia Pacific region, the non daylight saving time difference here is 13 hrs, which mean the market starts at 10.30 pm local time and I have a Chinese New Year dinner with some of my business associates. I know that I can’t possible be back to execute the trades and it won’t be polite to bring my lap top along to work.
The only way possible to enjoy my dinner without any interruptions and not worrying that I’ll miss the opportunity of a possible bearish reversal trade, I set all the three orders to “conditional order” that is to be triggered if only the stock price drop below the entry signals.
Here are the following orders I have set up on my Interactive Brokers trading platform.
1. STR Apr08 $50 Put @ market, if stock price < $50.50 2. KSS Apr08 $45 Put @ market, if stock price < $46.00
3. PVH Jun08 $40 Put @ market, if stock price < $40.50
The next morning when I switch on my computer to check on my trades, this is what happens last night when I was enjoying my dinner with my friends.
1. STR not filled as the stock was bullish.
2. KSS Apr08 $45 Put filled at $3.20 and closed at $3.60, $0.40 or 12.5% profit.
3. PVH Jun08 $40 Put filled at $4.50 and closed at $5.00, $0.50 or 11.1% profit.
All the three trades were set to trigger mechanically by the stock itself. I don’t do the deciding, the stock does it for me. This eliminates the chance of emotional trading. For STR, the stock was bullish and it does not hit the entry point so the order was not triggered. There are no predictions involved; it’s the stock that tells me what I should do and does it for me. I just set it on auto pilot mode so that I can enjoy my dinner.
You see that’s the way how trading should be, it should not affect you and your social life. You do not have to be in front of your computer for 10 hours every trading day in order to make money. This is crazy, too much stress and it’s ridiculous, it will only lead you into addiction and you will become a high flying gambler. Stop immediately if you are on the graveyard shift, it will affect your life and your family’s life. You too can enjoy your life while trading options. Do it the smarter way.
“Those who have knowledge don’t predict. Those who predict don’t have knowledge” – Lao Tzu (604 BC - 531 BC)
Case Study #1 Phillips-Van Heusen Corp
PVH is an excellent example of a put options trading for profit that is signaled by the stocks itself. All you need to do is to follow the signals and set your orders on automation. This set up will removed your emotions and not to be taken over by your greed.
The bearish reversal candlestick formation was spotted on Feb 15 before market opens and the trading Plan for PVH entry was set up as follows.
PVH was trading at $41.65 and if stock price is below $40.50 which is the low of the reversal candlestick, then buy Jun 08 $40 puts.
A condition order was set up for PVH
Jun08 $40 Put @ market, if stock price < $40.50
The next morning when I switch on my computer to check on my trades, the order was triggered as the stock plunge below $40.50 and PVH Jun08 $40 Put filled at $4.50 and closed at $5.00, $0.50 or 11.1% profit in the same day.
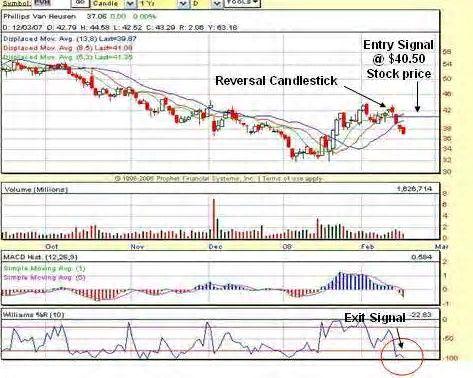
After three trading days the stock was down at $37.00, the option premium has increased to $5.80. Looking at the chart the MACD histogram is at about half way, still have room to drop but the William %R is at the bottom sending me a signal to exit.
The question is which indicator to depend on? If you are greedy you would have stay on, base on my experience it is better to get out even if there is a possibility to drop some more.
The stock open lower, many would have refused to get out, by then the options has gone up to $6.20. I set my stop to $6.10 to protect my profits if it turns around during half time which is common and I can sleep without any worries of my profits being wiped out.
The stock has indeed turn around and the stop was trigger at $6.00, giving me $1.50 profit which is about 25% profits in 4 trading days.
Many who take big risk on earnings will see it as small profit but I can sleep soundly without any stress. I obviously don’t want to win big one day and get a heart attack the next day. Trading should be relaxed and it has to be consistent. It should not affect our life physically or emotionally.
Case Study #2 Foundation Coal Holdings Inc
FCL was spotted a bearish reversal candlestick formation on 29 Feb before market opens which fulfilled all the bearish reversal conditions coupled with a strong negative divergence present in the stock chart.
FCL was trading at $57.77 and the low was at $56.83 and the trading plan for FCL entry was set up using a conditional order.
If stock price < $56.60, buy Apr 08 $60.00 Puts
However the order was only triggered 4 days later @ $6.50 when the stock falls below the entry point. Having paid $3.10 for the time value leaving behind $3.40 in intrinsic value, I must bear in mind that if the stock moves sideways, time decay is going to be harmful to this trade.
A stop loss was then set at $4.50 giving enough room for the daily noises and a maximum of two weeks holding period.
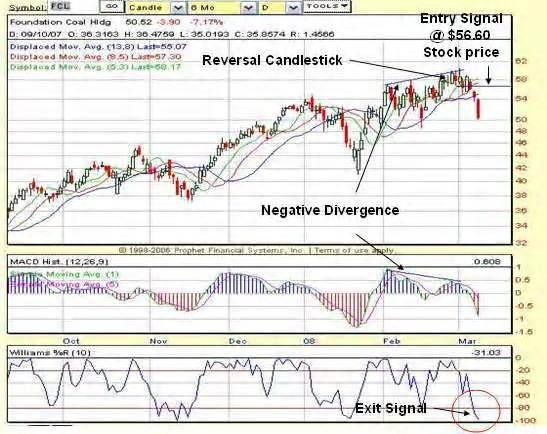
By the 10 Mar 08, after eight trading days the stock is down to closed at $50.52, the option premium has increased to $10.30 giving me a profit of $3.80, a 58% returns.
Looking at the chart the MACD histogram is now at negative territory indicating a possible longer term bearish trend but William %R is at the bottom signaling me to get out.
Here comes the greed and the fear factor, greedy to want more profits and at the same time fear of losing out the profits if the stock turns around. In order not to be effected by this emotion a trailing stop of $0.40 was set. This means that if the stock keeps on falling the profits will be maximized and on the other hand if the stock reverses back up then it would trigger the trailing stop to exit the position.
Setting my trades on automated mode gives me plenty of time to blog (www.StreetSmartOptions.com) while I trade and I don’t have to stare at the charts for opportunity.
Case Study #3 Goldcrop Inc
GG was spotted a bearish reversal candlestick formation on 17 Mar 08 after market closed which maybe due for a minor market correction as there was a negative divergence present in the stock chart. The stock rating was 8 and the analyst recommendation was moderate buy making this reversal play contrary.
GG was trading at $44.22 and the low was at $43.00 and the trading plan for GG entry was set up using a conditional order.
If stock price < $42.90, buy Jul 08 $45.00 Puts
However the order was triggered the next day on 18 Mar 08 @ $6.00 when the stock falls below the condition set. Having paid $3.90 for the time value leaving behind $2.10 in intrinsic value for a 120 days option, I guess it all right as the maximum holding period is only 2 weeks. The time decay effect is not so damaging to this position.
A stop loss was then set if stock price is > $46.40, which is the high of the reversal candlestick.
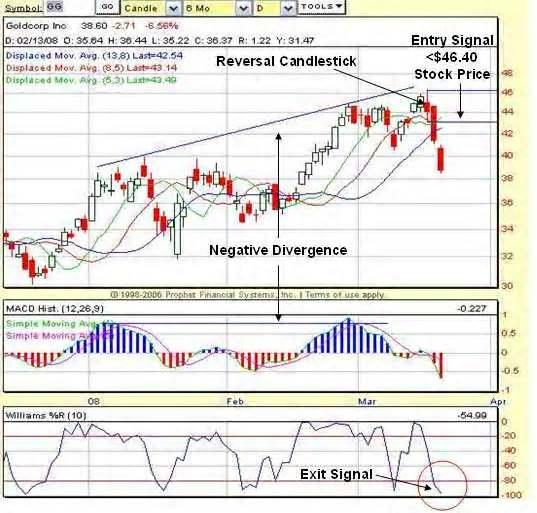
Yesterday 10 Mar 08, after only one day the stock is down to closed at $38.71, the option premium has increased to $7.90 giving me a profit of $1.90, a 32% returns.
Looking at the chart the MACD histogram is now at negative territory indicating a possible longer term bearish trend but William %R is at the bottom signaling me to get out.
I took my profit when the market opens the next day and move on to the next trade, remember always take your profit, don’t be greedy. Move on.
Case Study #4 Agnico-Eagle Mines Limited
AEM was spotted a “Shooting Star” bearish reversal candlestick formation yesterday on 19 Mar 08 before market opens which is due for a market correction as is was trending for some time. It was supported be a strong negative divergence present in the stock chart. AEM was trading at $74.10 and the low was at $73.50 and the trading plan for AEM entry was set up using a conditional order.
If stock price < $73.40, buy May 08 $75.00 Puts
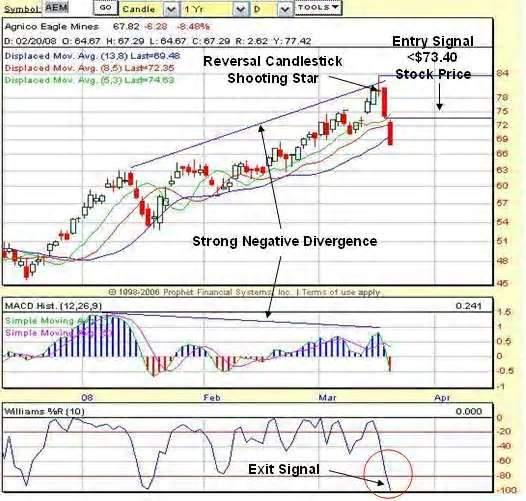
However the order was triggered on the same day itself @ $8.40 when the stock falls below the condition set. Having paid $6.80 for the time value leaving behind $1.60 in intrinsic value for a 60 days option, is a very expansive premium to pay as the IV was very high.


I took this trade because the negative divergence was very strong bearing in mind that it is going to be a real short trade. Since only one day the stock is down to closed at $68.12, the option premium has increased to $10.30 giving me a profit of $1.90, a 23% returns.
The William %R indicator is at the bottom again sending me a signal to take my profit get out. Money in my pocket is always better than in the market.
Case Study #5 McKesson Corporation
MCK was the third bearish reversal trade I did together with ACOR and ABT. It is the most profitable one indeed; I managed to pocket a profit of 117% in 10 trading days. Spotted a “Dark Cloud Cover” bearish reversal candlestick formation on my screener on 15 Jan 08 which have gapped up in the stock price three months ago and were making higher highs since then.
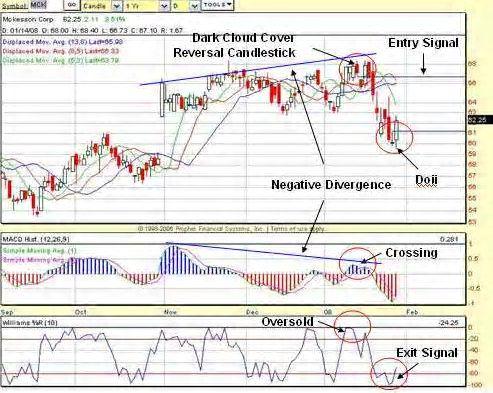
There was a strong negative divergence shown on the MACD Histogram, the strongest amount the three (ACOR, ABT and MCK) and the possibility of closing the gap.
MACD Histogram, the SMA 1 (green line) is about to cross the SMA 5 (pink line), a bearish reversal signal.
William %R is high in the over bought region, giving plenty of room to fall.
The stock price was at all time high at $68.50 acting as resistance, forming a possible double top.
The reversal candlestick was spotted on 15 Jan 08 before the market opens.
Trading plan set at if stock price < $66.50, the low of the bearish candlestick, buy Mar 65 Put and was filled @ $2.30, stop loss set at $1.20,
On the 28 Jan, Monday, after the stock has dropped $6.50, a “Doji” was seen in the chart. A “Doji” represents uncertainty, a possible turn around. William %R is touching the floor sending me a second exit signal.
Exit Plan is to get out immediately when the price is above Monday’s high.
The stock rally on Monday’s open and hit the exit signal at about 50 minutes after opens and I managed to get out at $5.00 making a profit of $2.70, 117% ROI.
The problem with many traders is too much greed, always wanted more and not decisive when getting out. Discipline and following your trading plan is crucial in achieving consistence profits.
“The financial markets generally are unpredictable. So that one has to have different scenarios.. The idea that you can actually predict what’s going to happen contradicts my way of looking at the market” – George Soros
Section 4


 Stock trading at $53.33 and when stock price is below $52.50, buy Apr 08 $50 Put.
 Stock trading at $46.27 and when stock price is below $46.00, buy Apr 08 $45 Put.
 Stock trading at $41.65 and when stock price is below $40.50, buy Jun 08 $40 Put.


