The resonant frequency is determined by the mass of the finished crystal which can be adjusted by grinding and the deposition of gold or other metal onto the crystal faces during manufacture. The adjustment is made to suit the intended method of operation, series or parallel, and at a specific temperature, usually 25æC. When parallel mode is specified, allowance is made for the load or circuit capacitance, usually 20–30 pfd, in parallel with C0.
A crystal’s resonant frequency varies with temperature and this temperature coefficient is determined by the angle at which the slice was cut from the parent crystal. Commonly used cuts are AT and BT. Because of its better performance AT is the most common.
Typical examples of the temperature coefficients for these are shown in Figure 7.3.
The temperature coefficient is specified, usually in parts per million (ppm) per degree C, or as a percentage, over a defined temperature range. The standard European temperature range is −10æCto +60æC. A crystal designed for a restricted temperature range has a better
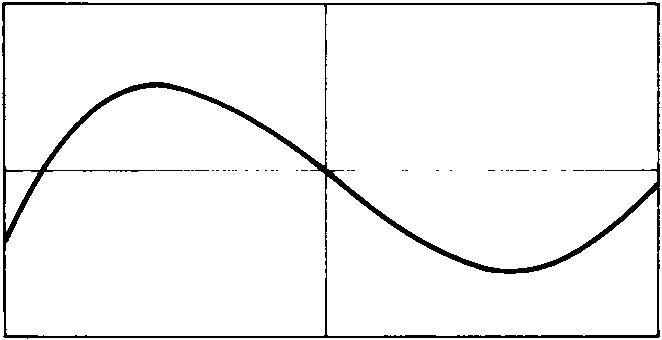 −2550 +25 +100−
+ 20
0
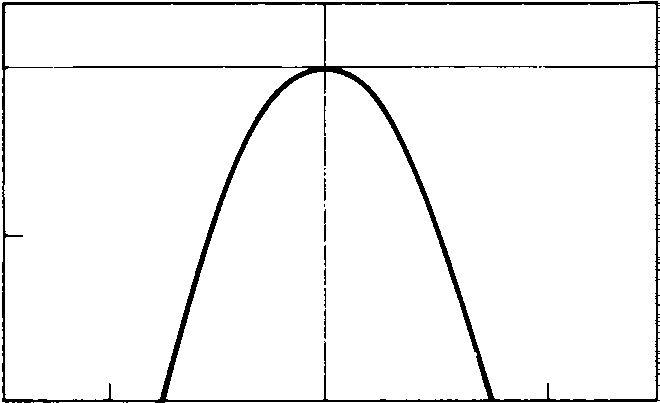 −50−25+25+75+100 Temperature (°C)
stability over that range than one designed for operation over a wide temperature range will have when used over a restricted range.
For higher frequency stability crystals may be operated in a temperature-controlled oven operating at a more constant high temperature.
Common frequency tolerance specifications are ±0.005% or 0.0025% from −55æCto +105æC. These include the frequency errors from all sources, including the calibration tolerance; thus, the temperature coefficient is slightly better than these figures.
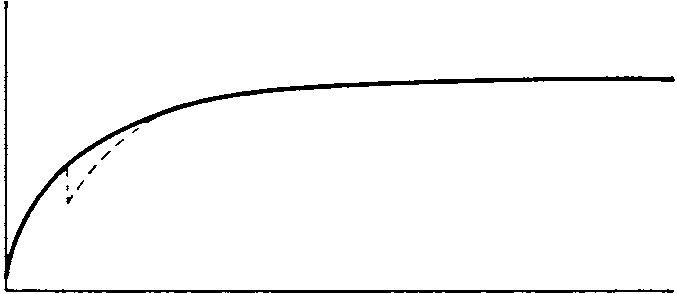
The resonant frequency shifts with age from that set at production, following a curve similar to that in Figure 7.4. Initially the frequency shift for a given period of time is rapid but slows with age. The frequency may shift in either direction, and although it is possible to specify crystals ageing in one direction – high stability oscillators for quasi-synchronous transmission systems is an application – they are selected from a batch, not specifically manufactured. Once a crystal has been operated, a subsequent long period of inactivity can produce a glitch in the ageing curve followed by a higher rate of change for a short time.
Rate of
change
of
frequency
 Period of non-operation
When a crystal is operated in the parallel mode across a low capacitance load the results are a higher frequency and larger output voltage to the load. Increasing the load capacitance causes a reduction in frequency approaching that of series resonance.
The change in frequency that can be achieved by varying the load capacitance – a small trimmer capacitor is often connected across the crystal for this purpose – is the crystal’s pullability. A typical pullability is from−1 ppm/pfd to−20 ppm/pfd for a total shunt capacitance of 40 pfd (C0 +Cload).
All these characteristics are interrelated. A crystal’s activity, its vibrational response, can be quoted in terms of the effective series resistance. A higher effective series resistance implies lower activity, lower output and lower Q. The usual range of ESRs is from 20 to 100 although higher values occur in some low frequency crystals. Some manufacturers may quote activity levels for crystals for use in a parallel mode as effective parallel resistance (EPR). The EPR is the value of the resistor which, if connected in lieu of the crystal in an oscillator, would give the same output level as the crystal. The higher the EPR, the greater the crystal activity and Q.
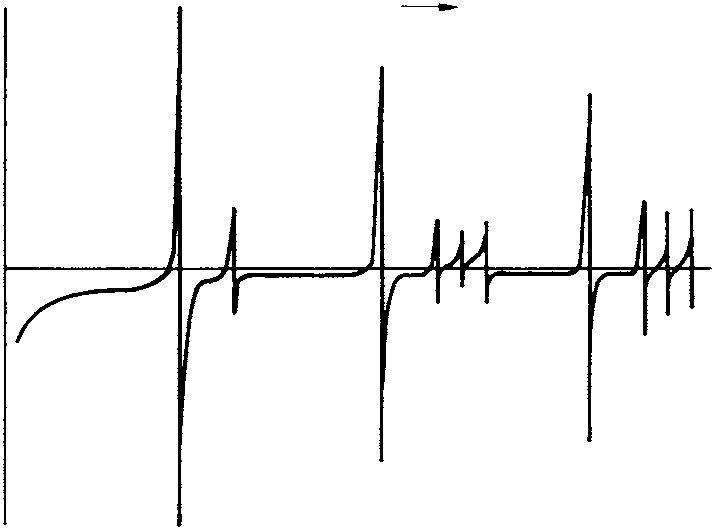
Crystals will resonate at frequencies other than those of the fundamental and harmonic modes for which they were designed; Figure 7.5 shows the overtone (harmonic) and some typical spurious responses. The spurious responses of overtone crystals can occur with very little separation from the desired overtone frequency requiring very careful oscillator design if they are to be avoided.
jX Frequency0 SpuriousSpurious responsesresponses
 −
−A wide range of mounting styles is available. The American military nomenclature is widely used to describe them and Figure 7.6 shows the outlines of some of the more popular styles.
19.6913.4813.468.819.09 6.34.9 12.55 4.9 3.75 12.35 nomnom nomnom
Solder HC6/U HC18/U − HC33/U HC25/U MIL seal AA J − BF CX IEC Cold HC36/U HC43/U HC45/U HC47/U HC42/U MIL weld DNC DPC EBC AC DQ IEC Glass HC27/U HC26/U − − HC29/U MIL
DA CY − − CZ IEC Res HC48/U HC43/U HC45/U HC51/U HC50/U MIL weld DNR DPR EBR RF RX IEC
7.3 7.0Solder − − − − MIL seal − − − − IEC Cold HC35/U − − − MIL weld DKC − − − IEC Glass − − − − MIL
− − − −IEC Res HC35/U HC49/4H − − MIL
weld DKR −
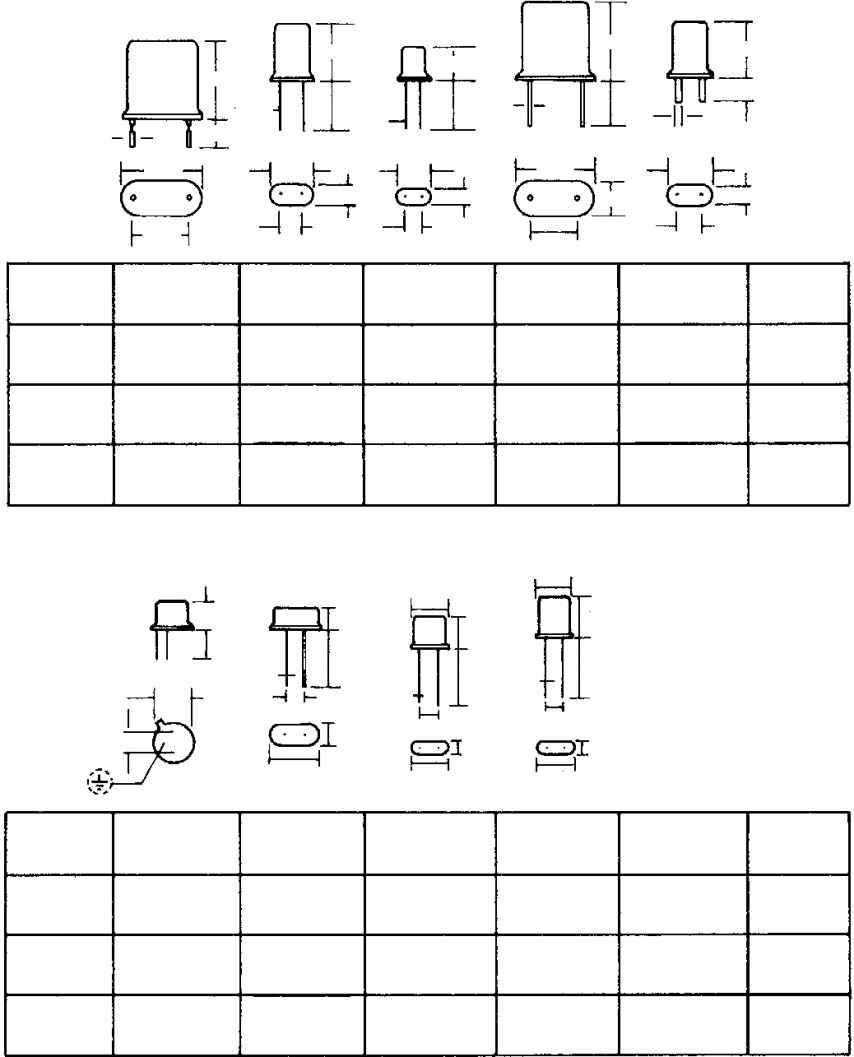 UM-5 UM-1 IEC Figure 7.6 Crystal case styles