Basic Publishing with MATLAB
MATLAB includes an automatic report generator called publisher. The publisher publishes a script in several formats, including HTML, XML, MS Word and PowerPoint. The published file can contain the following:
Commentary on the code,
MATLAB code,
Results of the executed code, including the Command Window output and figures created by the code.
publish Function The most basic syntax is publish('file','format') where the m-file is called and executed line by line then saved to a file in specified format. All published files are placed in the html directory although the published output might be a doc file.
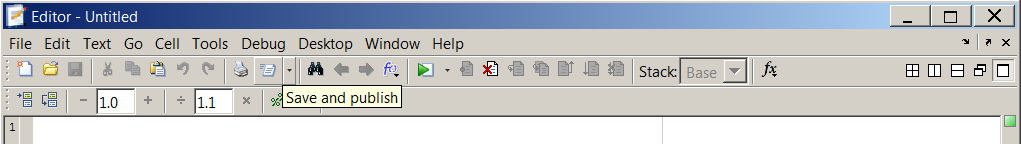
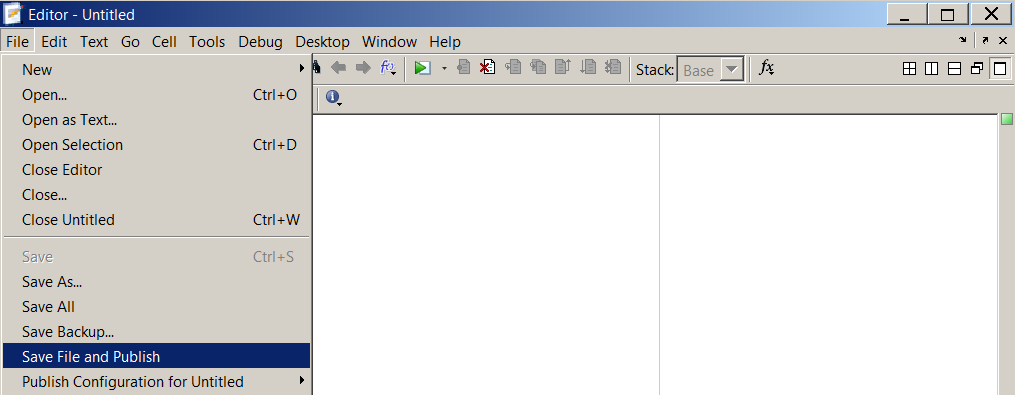
The publisher is easily accessible from the Editor toolbar and file menu:
Write a simple script and publish it in an html file.
Select File > New > Script to create an m-file. Once the editor is opened, type in the following code:
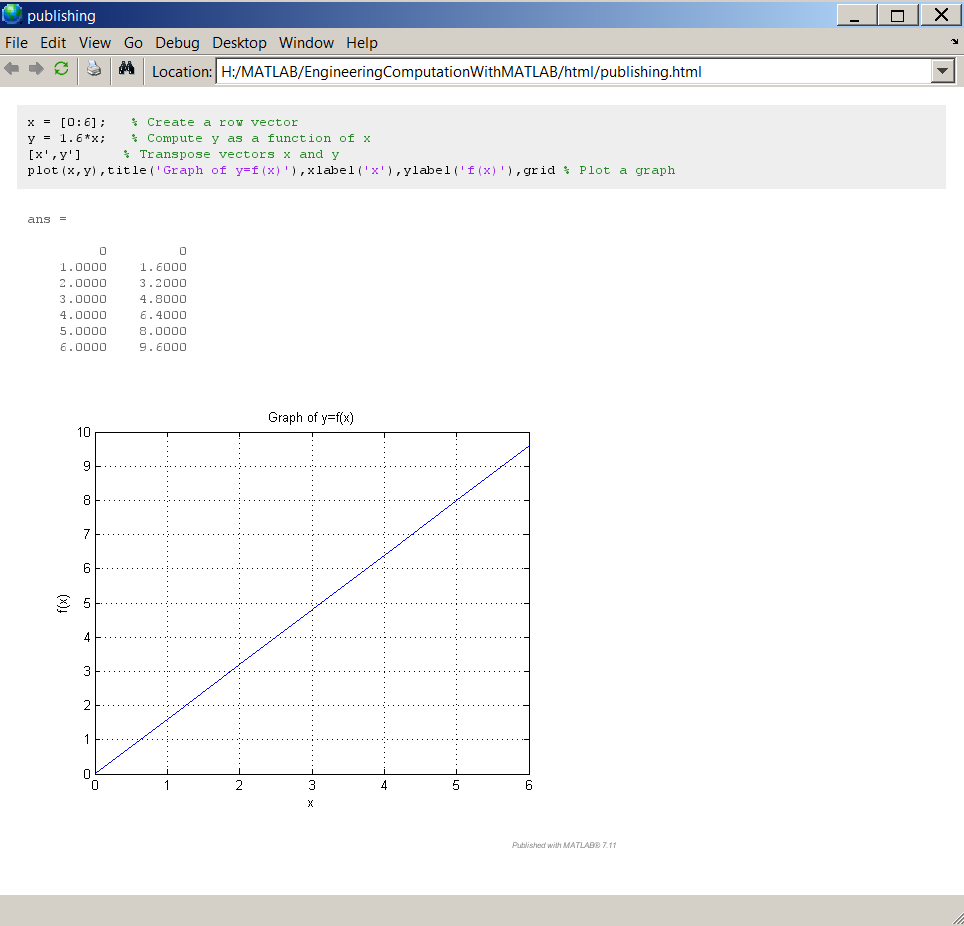
x = [0:6];   % Create a row vector
y = 1.6*x;   % Compute y as a function of x
[x',y']     % Transpose vectors x and y
plot(x,y),title('Graph of y=f(x)'),xlabel('x'),ylabel('f(x)'),grid % Plot a graph
Save the script as publishing.m and select File > Publish. An HTML file is generated as shown in the figure below:
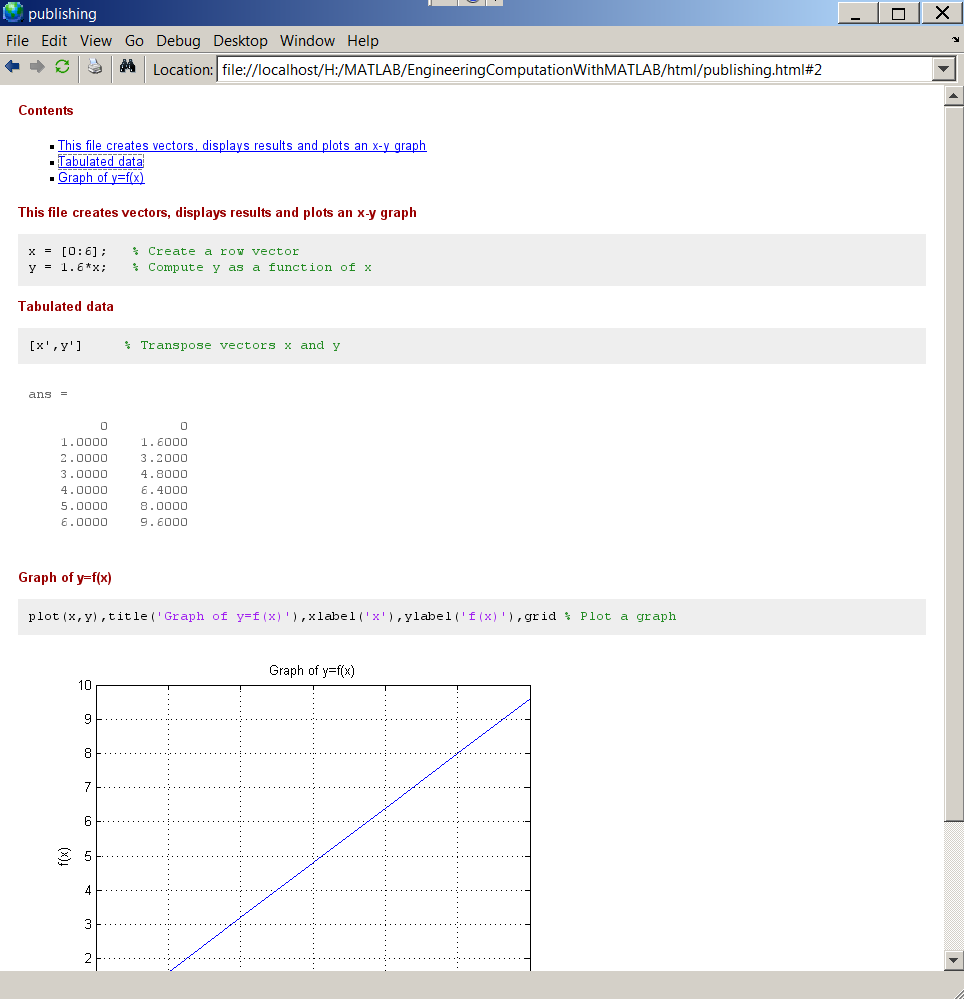
%% Sign The scripts sometimes can be very long and their readability might be reduced. To improve the publishing result, sections are introduced by adding descriptive lines to the script preceded by %%. Consider the following example.
Edit the script created in the example above to look like the code below:
%% This file creates vectors, displays results and plots an x-y graph
x = [0:6];   % Create a row vector
y = 1.6*x;   % Compute y as a function of x
%% Tabulated data
[x',y']     % Transpose vectors x and y
%% Graph of y=f(x)
plot(x,y),title('Graph of y=f(x)'),xlabel('x'),ylabel('f(x)'),grid % Plot a graph
Save the script, a new HTML file is generated as shown in the figure below:
MATLAB can generate reports containing commentary on the code, MATLAB code and the results of the executed code,
The publisher generates a script in several formats, including HTML, XML, MS Word and PowerPoint.
The Double Percentage %% can be used to creates hyper-linked sections.