Bollinger Bands: trend and volatility
Another very useful technical analysis tool was suggested by John Bollinger and is called Bollinger bands. Bollinger bands define a channel with the width proportional to the current market volatility around the moving average trend line. Typically we take 20– days simple moving average and step up and down two standard deviations from it. So, we calculate
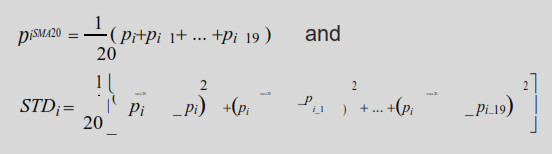
and draw three lines on the chart (see figure). Here is a short list of predictions you can draw from the Bollinger bands:
• If band tightens as the volatility shrinks, you can expect a sharp price move to follow;
• A price move that starts at one band usually carries to the other one;
• When price moves outside of the band (provided the band itself is not falling or rising steeply), the current trend will usually continue.