Trend signals: patterns and crossovers
Well, what can you learn from the moving averages? First, we can find the trend: if our EMA or SMA goes down, the long-term trend is falling, if it goes up, we have a long-term uptrend.
How can we determine when the uptrend changes into a downtrend? Our averages can help us here as well using a technique called “double crossover”. If we plot, for instance
EMA10 and EMA50, the point where EMA10 crosses above EMA50 indicates a crossover to rising trend and is called “golden cross”. If EMA10 crosses below EMA50, this is a “dead cross” signaling the beginning of a bearish market. Another type of signal can be created when the actual price crosses the average, “price crossover”.
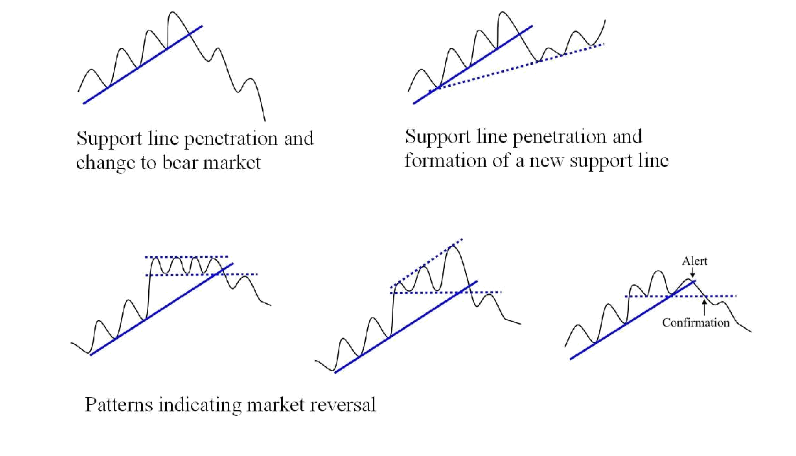
The crossover techniques are very useful when a long term trend exists. If the price is volatile, it might create many false alarms. Useful indicators can be obtained by drawing support and resistance lines. These lines are defined by traders" psychology(greed, first of all) and represent the issue of supply and demand. Support is the level at which buyers take control over the market and prevent prices from falling further down. On contrary, at the resistance level, sellers take control over the prices and prevent them from rising higher. Breaking through support or resistance lines often signals the beginning of a different trend. The drawing below ill¬ustrates commonly occurring patterns and shows predicting power of support and resistance lines.