Let us try analyzing a real Bitcoin chart!
Now we know enough to apply some basic technical analysis and try to make a forecast. You already know enough to make a qualified decision. I use the data downloaded from BTC-e.You can not only plot the Bitcoin price and volumecharts on this web site but also get the entire set of data by clicking
“Load raw data”. Following the recipes in the previous sections, we did some calculations in MS Excel and plotted the last few months of data together with EMA10, EMA50 and Bollinger Bands.
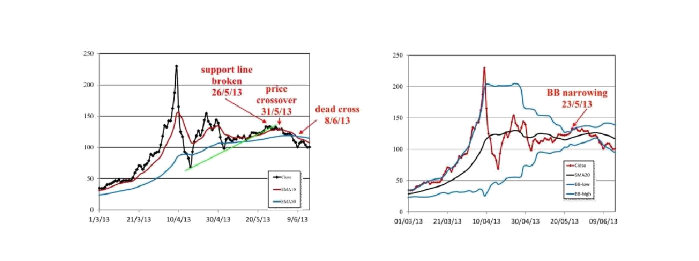
According to the Bollinger band behavior, we observe tightening of the band which could indicate a forthcoming change in trend. Indeed, the support line was broken on May 26th followed by a downwards price crossover on May 31st and a “dead cross” on Jun 6th. We could therefore conclude that the current Bitcoin trend is downwards. The market can possibly find support at around $100, but the data is inconclusive so far. The advice to a short-term investor would be to wait and not to enter the market at this moment in time.