Tseng, H. F. & Li, S. S. (1972). Phys. Rev. B 6 (8): 3066.
Vincent, G., Bois, D. & Chantre, A. (1982). Photoelectric memory effect in gaas, Journal of
Applied Physics 53: 3643.
Wertheim, G. (1959). Phys. Rev. 115: 37.
Yarykin, N., Sachse, J.-U., Lemke, H. & Weber, J. (1999). Phys. Rev. B 59: 5551.
Yoffa, E. (1981). Phys. Rev. B 23 (4): 1909.
Part 6
Laser Devices and Methods
25
Electromechanical 3D Optoelectronic Scanners:
Resolution Constraints and
Possible Ways of Improvement
Oleg Sergiyenko1, Vera Tyrsa2, Luís C. Basaca-Preciado1,
Julio C. Rodríguez-Quiñones1, Wilmar Hernández4, Juan I. Nieto-Hipólito1,
Moisés Rivas Lopez1 and Oleg Starostenko3
1Autonomous University of Baja California, Mexicali-Ensenada,
2Polytechnic University of Baja California, Mexicali,
3Universidad de Las Americas, Puebla,
4Polytechnic University of Madrid,
1,2,3Mexico
4Spain
1. Introduction
Non-Contact optoelectronic 3D measurement is a rapidly growing field. Three-Dimensional
Non-Contact Measurement Technologies are very common for research due to multiple
practical applications expecting for its benefits. Many fields are using in any way 3D
measurements or shape recognition, some of them there are vision assisted assembly in
various branches of industry, autonomous mobile robots navigation, structural health
monitoring, micro surfaces inspections, precise automated surgery, etc.
In this chapter it is expedient to mention and briefly cross-compare the following emerging
technologies for 3D measurements: laser scanners, lasers based on conoscopy holography
technology and 3D cameras.
Laser scanners: Most contemporary non-contact 3D measurement devices are based on laser
range scanning. The simplest devices (Fischer, 2007) are based on the laser triangulation
technique. This is an active stereoscopic technique in which the distance of the object is
computed by means of a directional light source and a video camera. The CCD camera’s 2D
array captures the image of surface profile and digitizes all data points along the laser
disadvantage of this method is that a single camera collects only a small percentage of the
reflected energy. The amount of the collected energy can be drastically increased by
trapping the entire reflection cone, thus significantly increasing the precision and reliability
of the measurements.
Lasers based on Conoscopic Holography technology: Conoscopic Holography is a simple
implementation of a particular type of polarized light interference process based on crystal
optics. In the basic interference set-up, a point of light is projected onto a diffuse object. This
point creates a light point, which diffuses light in every direction. In a conoscopic system, a
complete solid angle of the diffused light is analyzed by the system. The measurement
550
Optoelectronic Devices and Properties
process retrieves the distance of the light point from a fixed reference plane. The problem
inherent in laser scanning is its relatively low measurement speed, though it is faster than
traditional contact Coordinate measurements machines (CMM’s).
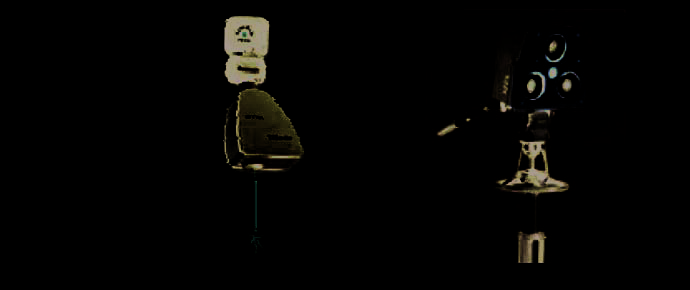
a)
b)
Fig. 1. A scanner laser (a) and a 3D camera (b)
3D cameras: 3D photography is based on reconstructing 3D data from 2D images, taken
from different points of view (stereo- graphic) the basic problem with this approach is the
correspondence problem. In 3D cameras a pattern is projected on the object and the same
pattern points are identified on each image. This approach is much more efficient, since it
does not require marking specific points, and it can produce a very large number of
measurements in one shot of camera.
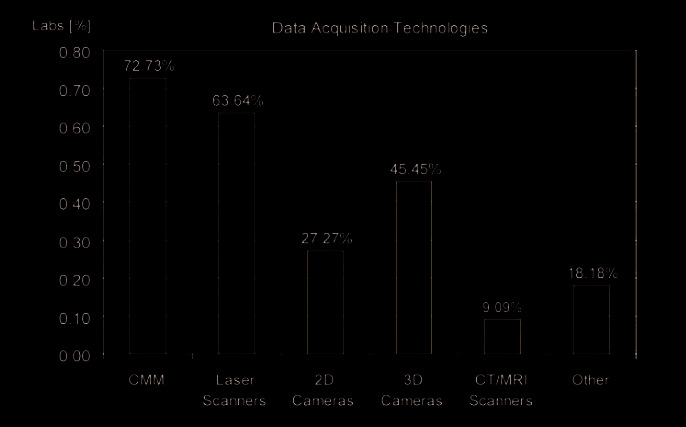
Fig. 2. Distribution of 3D scanning technologies among 23 engineering universities and
research centers across Europe according to (Fischer, 2007)
Electromechanical 3D Optoelectronic Scanners:
Resolution Constraints and Possible Ways of Improvement
551
The typical distribution of 3D scanning technologies research among engineering
universities and research centers is given on Fig.2. CMM is still numerous due to non-
innovative routines in industry with traditional investments for research. But this
technology is contact and applicable for very limited area of tasks. So, the future is for laser
scanning and 3D camera vision.
In fact, specialists already get a consensus regard to most evidences of these two branches.
Cameras are winning in a point of less energy consuming and a relatively longer range of
action. But laser scanning systems always win at resolution, accuracy and data processing
time.
Basing in this, it is easy to show that for various tasks (such as: vision assisted assembly,
robot navigation in densely cluttered environment, structural health monitoring, etc.) the
laser scanner is an optimal way to obtain quality 3D information about objects in nearest
surrounding in higher resolution.
But the majority of modern laser scanners have a certain part of rotating/moving
electromechanical components, which are closely related with such negative phenomenon
like mechanical vibrations, friction and wear, mechanical delays, etc.
Present paper scope is precisely to research what are the most prospective ways to increase
the electromechanical laser scanners resolution and robustness. With this aim let us deeper
study most typical approaches to laser scanner construction, as one of the most promising
technical vision system (TVS).
2. Typical laser scanner constructions and their constraints
According to the recent literature electromechanical laser scanners have sufficiently variety
in its constructions. At the same time, they have enough similarities and common
components in its general structure. Let will see some of the typical constructions of
electromechanical laser scanners for to have the possibility systemize such constructions and
define their common advantages and lacks.
An obvious optimization of the measurement system (Wulf & Wagner, 2003) is to take the
scanning method that is most suitable for the application. However, taking a 2D laser
scanner with 180° scanning range and a servo drive it results in a number of possible
combinations of scan planes and rotation axis to get a 3D scan. This section describes four of
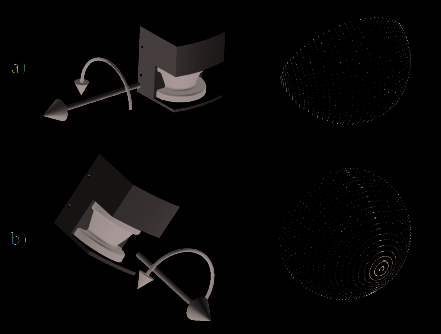
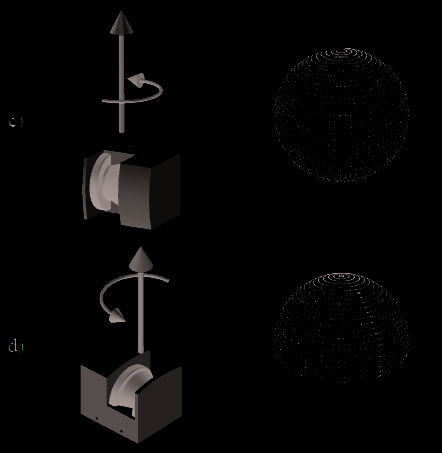
these combinations. We have named the scanning methods as pitching scan, rolling scan,
yawing scan and yawing scan top. The pitching scan (Fig. 3a) has a horizontal scan plane and is pitching up and down. This method is for example used in (Surmann et al., 2001) and
(Hähnel & Burgard, 2002). A method that is newly introduced here is the rolling scan (Fig.
3b). This scan is rotating around the center of the scanner, with the advantage of only one
focus point in front of the sensor. The yawing scan (Fig. 3c) and the yawing scan top (Fig. 3d)
has a vertical scan plane and is rotating around the upright z-axis. This method is used e.g.
by (Wulf, O. & Wagner, B. (2003).
Let us compare constructions and advantages/disadvantages of the different laser scanner
constructions according to the next literature sources: (Son et al., 2002), (Wulf & Wagner,
2003), (Nüchter, 2007), (Nüchter, 2008), (Wulf et al., 2004), (Surmann, 2003), (Surmann et
al., 2001), (Hähnel & Burgard, 2002), (Blais et al., 1988), (Blais et al., 2000), (Beraldin et al.,
2000), (Andersen et al., 2006), (Laurin et al., 1996 ), (Blais et al., 1991), (Klöör et al., 1993),
(Vandapel et al., 2004), (Montemerlo & Thrun, 2004), (Pagnottelli et al., 2005), (Sergiyenko et
al., 2006).
552
Optoelectronic Devices and Properties
Fig. 3. The pitching scan (a), the rolling scan (b), the yawing scan (c) and the yawing scan top (d) (Wulf & Wagner, 2003)
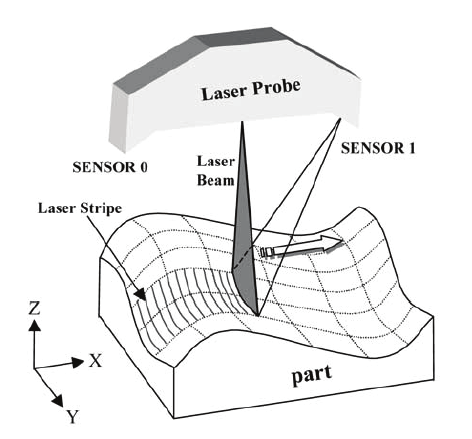
2.1 Automated laser scanning system for reverse engineering and inspection
The mechanism of the 3D laser scanner used in this research (Son et al., 2002) is illustrated in
Fig. 4. A laser stripe is projected onto a surface and the reflected beam is detected by CCD
cameras. Through image processing and triangulation method, three-dimensional
coordinates are acquired. The laser probe is mounted on a three-axis transport mechanism
and moves along the scan path that consists of a series of predetermined line segments. It
also rotates in two directions.
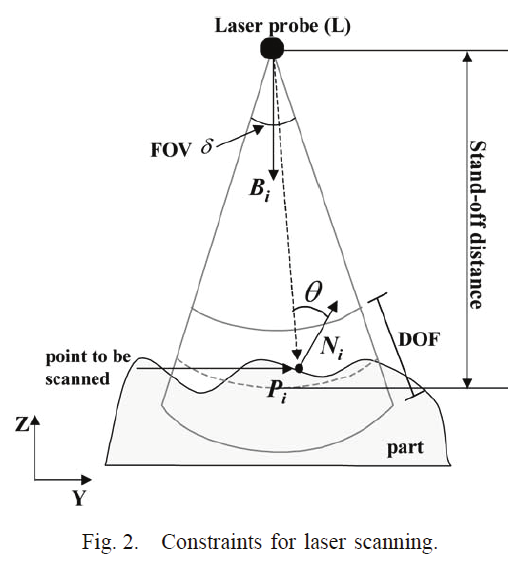
When the laser scanner captures an image, the system automatically finds an optical focus
and keeps the standoff distance. The length of laser stripe and the stand-off distance cannot
be changed by an operator. Since a laser scanner consists of optical sensors and mechanical
moving parts, various constraints must be satisfied when measuring a certain point on a
part (Fig. 5). The goal of this section is to generate an optimal scan plan that satisfies the
following major constraints (Zussman et al., 1994):
Electromechanical 3D Optoelectronic Scanners:
Resolution Constraints and Possible Ways of Improvement
553
Fig. 4. Laser scanning mechanism
Fig. 5. Constraints for laser scanning
1. View angle: the angle between the incident laser beam and the surface normal of a point
being measured should be less than the maximum view angle γ
d • N ≥
γ (1)
i
i
cos( ),
where
L − P
i
d =
(2)
i
.
L − Pi
2. FOV: the measured point should be located within the length of a laser stripe
554
Optoelectronic Devices and Properties
⎛ δ ⎞
(− d • B ≥
(3)
i )
cos⎜ ⎟,
i
⎝ 2 ⎠
where δ is the FOV angle
3. DOF: the measured point should be within a specified range of distance from the laser
source
l
l
DOF
DOF
l
−
≤ L − P ≤ l
+
(4)
STAND
i
STAND
,
2
2
where lSTAND and lDOF denotes stand-off distance and DOF length.
4. Occlusion: the incident beam as well as the reflected beam must not interfere with the
part itself.
5. The laser probe should travel along a path that is collision-free.
6. If the part is shiny or transparent, preprocessing is required such as spraying.
2.2 Range error analysis of an integrated time-of-flight, triangulation and
photogrammetric 3D laser scanning system
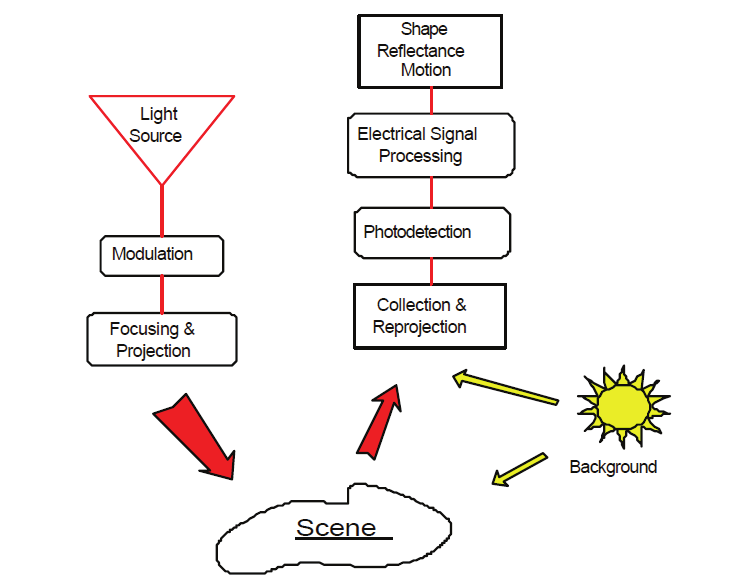
Laser scanner model (Blais et al., 2000). Models must be able to relate design parameters,
laboratory measurable, and operational performance. Figure 6 illustrates the major
subsystems of an active electro-optical system: projector sources and collimating optics,
deflection mechanism, collecting optics, detector, signal conditioning and processing, and
final output. The collecting optics images the radiation onto the detector. In the example of
Figure 7, the scanner optically moves the detector’s instantaneous field-of-view (IFOV)
across the total field-of-view (FOV) to produce an output voltage (signal) proportional to the
local scene intensity (produced by ambient light conditions) and the laser light reflected
back from a reflective surface.
Fig. 6. Generic sensor operation applied to active electro-optical systems
Electromechanical 3D Optoelectronic Scanners:
Resolution Constraints and Possible Ways of Improvement
555
The detector is at the heart of the electro-optical system because it converts the scene
radiation (reflected flux) into a measurable electrical signal. Amplification and signal
processing creates a signal in which voltage differences represent scene intensity differences
due to various objects in the field-of-view.
The majority of electro-optical quality discussions are centered on resolution and sensitivity
evaluation. System sensitivity deals with the smallest signal that can be detected. It is
usually taken as the signal that produces a signal-to-noise ratio of unity at the system
output. Sensitivity is dependent upon the light-gathering properties of the optical system,
the responsivity of the detector, the noise of the system and, for this application, the
background flux. It is independent of resolution.
In the case of metrology, resolution is not sufficient and stability and accuracy must also be
considered. Resolution has been in use so long that it is thought to be something
fundamental, which uniquely determines system performances and is often confused with
accuracy. It is often specified by a variety of sometimes-unrelated metrics such as the Airy
disk angular size, the detector subtense, or the sampling frequency. Resolution does not
usually include the effect of system noise.
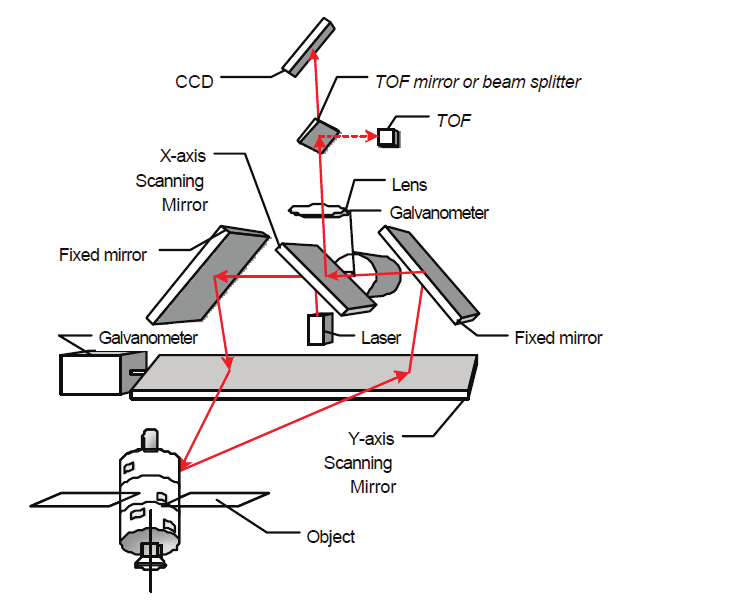
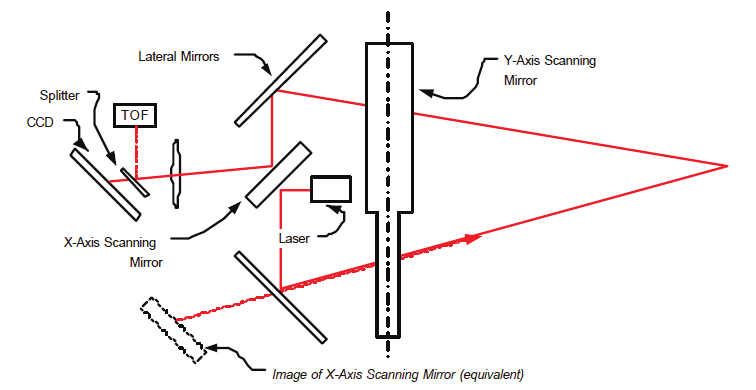
Fig. 7. Schematic representation of the auto-synchronized geometry
2.3 The auto-synchronized laser scanner
Figure 7 shows a photograph of the prototype of the auto-synchronized laser scanner
developed for this demonstration. The scanner uses a variation of the auto-synchronized
triangulation range sensor based on one galvanometer (Blais et al., 1988). The system
comprises two orthogonally mounted scanning mirrors and a linear discrete-response
photosensitive position device (e.g. linear CCD) used for short to medium range
measurement as triangulation (Beraldin et al., 2000). An optional avalanche photo-diode-
based Time-of-Flight (LIDAR) ranging module is used for longer-range measurement
556
Optoelectronic Devices and Properties
(Laurin et al., 1996). Only resolved targets using TOF are considered for this application.
Laser illumination is provided using a laser source coupled to a single-mode fiber, either
pulsed (TOF mode) or CW (triangulation mode). The laser scanner operates at a relatively
eye safe wavelength of 1.5 mm (compared to visible laser wavelengths).
The basic concept of auto-synchronization is that the projection of the light spot is
synchronized with its detection as illustrated in Figure 7. The instantaneous field of view
(IFOV) of the position sensor follows the spot as it scans the scene. Therefore, an external
optical perturbation can potentially interfere with the detection only when it intersects the
instantaneous field of view (IFOV) of the scanner. At this level, electronic signal processing
is used to filter these false readings to obtain correct 3-D measurement (Blais et al., 1991).
With synchronization, the total field of view (FOV) of the scanner is related to the scanning
angles of the galvanometers and mirrors as opposed to a conventional camera-based
triangulation. Here the field of view and image resolution are intimately linked (Blais et al.,
1988); a large field of view produces a lower pixel resolution. In summary, the instantaneous
field-of-view of the scanner plays a major role in the system sensitivity analysis.
2.4 Range measurement
Figure 7 shows the optical geometry of the auto-synchronized laser scanner. The laser
scanner system can measure range information for each voxel (3-D pixel) in the scene
using two modes of operation: (1) triangulation as illustrated in Figure 8, and (2) time-of-
flight shown in Figure 9. It is beyond the scope of this paper to discuss the details of
operation of the scanner and the exact mathematical model. This information is available
from previous publications where the scanner is operated in imaging mode (Blais et al.,
1988; Beraldin et al., 1993; Beraldin et al., 2000). Here, we will use the simplified models
illustrated in Figure 10 to model range measurement and to associate object pose
estimation obtained using video camera models shown in Figures 10 and 11 and
techniques discussed in section 4.
Fig. 8. Simplified geometry of the laser scanner for the triangulation mode
Electromechanical 3D Optoelectronic Scanners:
Resolution Constraints and Possible Ways of Improvement
557
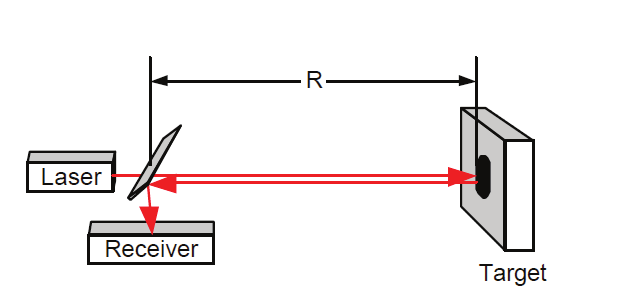
Fig. 9. Schematic of the time-of-flight principle
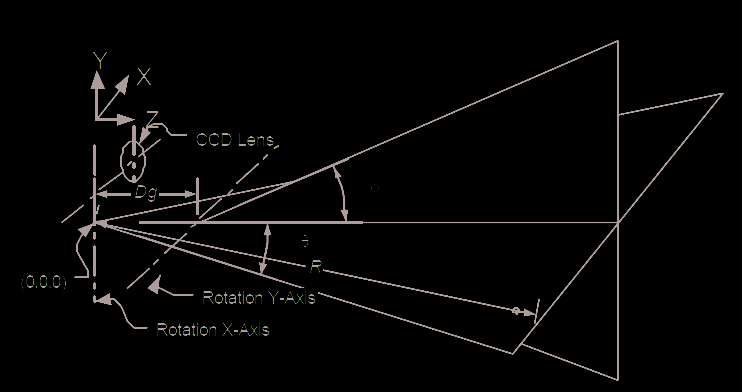
Fig. 10. Simplified geometrical model of the laser scanner showing the effect of astigmatism
between the X and Y scanning axis
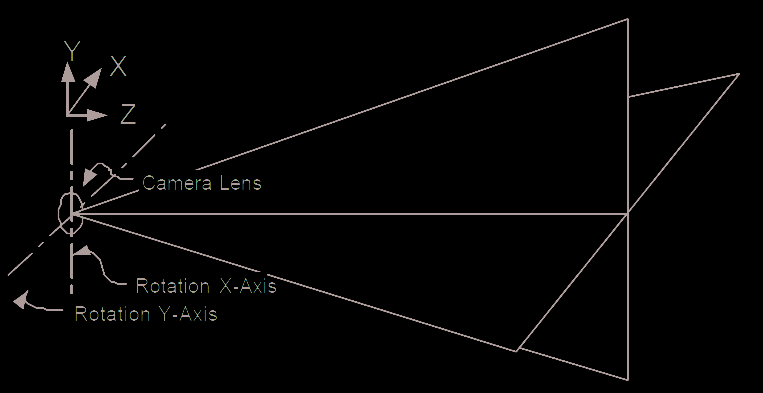
Fig. 11. Simplified geometrical model of a simple camera lens system used by conventional
camera and photogrammetric methods
From (Blais et al., 1988), knowing that R=z/cos(θ), and from Figure 10, range R can be
calculated either using triangulation methods or TOF. The simplified aberrations free model
is presented here. For triangulation, range is given by
f ⋅ d
R
=
cos(θ ) + d sin θ (5)
Trian
( )
p
558
Optoelectronic Devices and Properties
where f is the focal length of the lens, d is the triangulation base, θ is the deflection angle following the x-axis, and p is the position of the imaged laser spot of the position sensor (see
(Blais et al., 1988) for details). For the TOF method of Figure 9, range is simply obtained
based on the speed of light c and the propagation delay τ of a laser pulse:
τ
R
= c (6)
TOF
2
From Figure 10, the x-y-z coordinates of a point are
⎡
⎤
⎡ x⎤
sin(θ )
⎢
⎥
⎢ y⎥ = R⋅⎢
(cos(θ)−
⎢ ⎥
ψ )sin(θ )
⎥ (7)
⎢
⎥
⎢ z⎥
⎣ ⎦
⎢(1− cos(θ ))ψ + cos(θ )cos(θ )⎥
⎣
⎦
where θ and φ are the deflection angles, and ψ=Dg/R where Dg is the separation between the two scanning axis shown in Figure 10. Range R is obtained using either RTrian or RTOF
depending on the operating mode of the scanner. Because Dg<<R, error propagation
calculations (in triangulation mode) can be approximated by
2
R
R
Δ
≈
p
Δ (8)
Trian
f ⋅ d
2
⎡Δ x⎤
⎡
sin(θ )
2
⎤
2
⎢
⎥
⎢
⎥ ⎛ R
⎞
Δ y = cos
⎢
⎥
⎢
(θ )⋅sin(ϕ)
2
⎥ ⎜
p
Δ ⎟ +
⎜ f d ⎟
⋅
⎢ z
Δ ⎥
⎢ cos
⎣
⎦
⎣
(θ )cos(ϕ) ⎥ ⎝
⎠
⎦
(9)
⎡
cos(θ )
2
2
⎤
⎡
0
⎤
⎢
⎥
⎢
⎥
+ −sin(θ ) ⋅ sin(ϕ)
2
2
R ⋅ Δθ + cos(ϕ )
2
2
R cos (θ )
2
⋅ Δ
⎢
⎥
⎢
⎥
ϕ
⎢ −sin
⎣
(θ )cos(ϕ) ⎥
⎢−sin
⎦
⎣
(ϕ)⎥⎦
where Δ p is the uncertainty associated with the laser spot measurement.
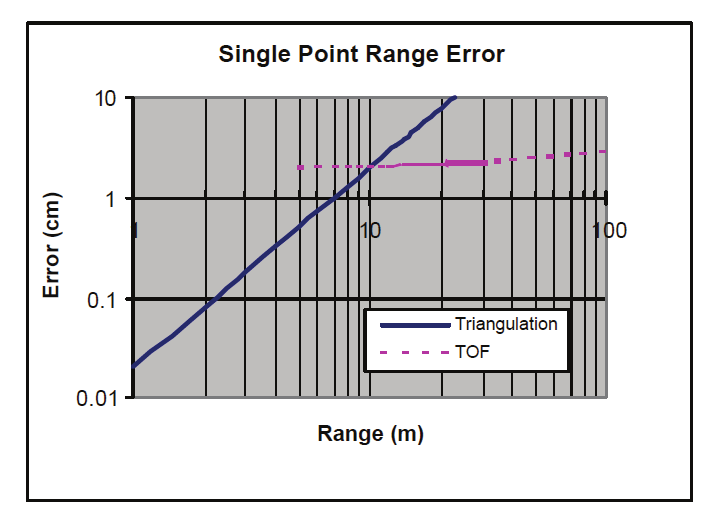
Fig. 12. Range error accuracy of the Laser Scanner System
Electromechanical 3D Optoelectronic Scanners:
Resolution Constraints and Possible Ways of Improvement
559
Figure 12 shows range error measured with the scanner in triangulation (notice the R2
dependence of the error), and from the manufacturer specifications for the TOF mode of
operation (notice the almost flat error over range). Other typical system parameters for the
prototype used in Figure 7 are maximum deflection angles of 0.5 rad (30 deg) and angular
errors of 50-100 µrad, depending on the target array. From equation 9 and Figure 12, the
total system error, for medium to long range, is