In this chapter, you will learn to:
Use set theory and Venn diagrams to solve counting problems.
Use the Multiplication Axiom to solve counting problems.
Use Permutations to solve counting problems.
Use Combinations to solve counting problems.
Use the Binomial Theorem to expand (x+y)n.
In this section, we will familiarize ourselves with set operations and notations, so that we can apply these concepts to both counting and probability problems. We begin by defining some terms.
A set is a collection of objects, and its members are called the elements of the set. We name the set by using capital letters, and enclose its members in braces. Suppose we need to list the members of the chess club. We use the following set notation.
A set that has no members is called an empty set. The empty set is denoted by the symbol Ø.
Two sets are equal if they have the same elements.
A set A is a subset of a set B if every member of A is also a member of B.
Suppose C={Al, Bob, Chris, David, Ed} and A={Bob, David}. Then A is a subset of C, written as A⊆C.
Every set is a subset of itself, and the empty set is a subset of every set.
Let A and B be two sets, then the union of A and B, written as A∪B, is the set of all elements that are either in A or in B, or in both A and B.
Let A and B be two sets, then the intersection of A and B, written as A∩B, is the set of all elements that are common to both sets A and B.
A universal set U is the set consisting of all elements under consideration.
Let
A be any set, then the complement of set
A, written as
 , is the set consisting of elements in the universal set
U that are not in
A.
, is the set consisting of elements in the universal set
U that are not in
A.
Two sets A and B are called disjoint sets if their intersection is an empty set.
List all the subsets of the set of primary colors {red, yellow, blue}.
The subsets are ∅, {red}, {yellow}, {blue}, {red, yellow}, {red, blue}, {yellow, blue}, {red, yellow, blue}
Note that the empty set is a subset of every set, and a set is a subset of itself.
Let F={Aikman, Jackson, Rice, Sanders, Young}, and B={Griffey, Jackson, Sanders, Thomas}. Find the intersection of the sets F and B.
The intersection of the two sets is the set whose elements belong to both sets. Therefore,
Find the union of the sets F and B given as follows.
The union of two sets is the set whose elements are either in A or in B or in both A and B. Therefore
Observe that when writing the union of two sets, the repetitions are avoided.
Let the universal set U={red, orange, yellow, green, blue, indigo, violet}, and P={red, yellow, blue}. Find the complement of P.
The complement of a set P is the set consisting of elements in the universal set U that are not in P. Therefore,

To achieve a better understanding, let us suppose that the universal set
U represents the colors of the spectrum, and
P the primary colors, then
 represents those colors of the spectrum that are not primary colors.
Let
U={red, orange, yellow, green, blue, indigo, violet},
P={red, yellow, blue},
Q={red, green}, and
R={orange, green, indigo}. Find
 .
.
We do the problems in steps.

We now use Venn diagrams to illustrate the relations between sets. In the late 1800s, an English logician named John Venn developed a method to represent relationship between sets. He represented these relationships using diagrams, which are now known as Venn diagrams. A Venn diagram represents a set as the interior of a circle. Often two or more circles are enclosed in a rectangle where the rectangle represents the universal set. To visualize an intersection or union of a set is easy. In this section, we will mainly use Venn diagrams to sort various populations and count objects.
Suppose a survey of car enthusiasts showed that over a certain time period, 30 drove cars with automatic transmissions, 20 drove cars with standard transmissions, and 12 drove cars of both types. If every one in the survey drove cars with one of these transmissions, how many people participated in the survey?
We will use Venn diagrams to solve this problem.
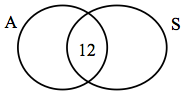
Let the set A represent those car enthusiasts who drove cars with automatic transmissions, and set S represent the car enthusiasts who drove the cars with standard transmissions. Now we use Venn diagrams to sort out the information given in this problem.
Since 12 people drove both cars, we place the number 12 in the region common to both sets.
 (a) | 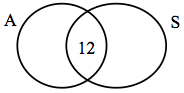 (b) | 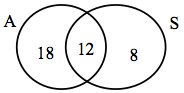 (c) |
Because 30 people drove cars with automatic transmissions, the circle A must contain 30 elements. This means x+12=30, or x=18. Similarly, since 20 people drove cars with standard transmissions, the circle B must contain 20 elements, or y+12=20 which in turn makes y=8.
Now that all the information is sorted out, it is easy to read from the diagram that 18 people drove cars with automatic transmissions only, 12 people drove both types of cars, and 8 drove cars with standard transmissions only. Therefore, 18+12+8=38 people took part in the survey.
A survey of 100 people in California indicates that 60 people have visited Disneyland, 15 have visited Knott's Berry Farm, and 6 have visited both. How many people have visited neither place?
The problem is similar to the one in Example 11.6.
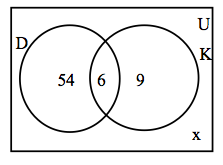
Let the set D represent the people who have visited Disneyland, and K the set of people who have visited Knott's Berry Farm.
 (a) | 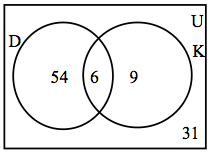 (b) |
We fill the three regions associated with the sets D and K in the same manner as before. Since 100 people participated in the survey, the rectangle representing the universal set U must contain 100 objects. Let x represent those people in the universal set that are neither in the set D nor in K. This means 54+6+9+x=100, or x=31.
Therefore, there are 31 people in the survey who have visited neither place.
A survey of 100 exercise conscious people resulted in the following information:
50 jog, 30 swim, and 35 cycle
14 jog and swim
7 swim and cycle
9 jog and cycle
3 people take part in all three activities
How many jog but do not swim or cycle?
How many take part in only one of the activities?
How many do not take part in any of these activities?
Let J represent the set of people who jog, S the set of people who swim, and C who cycle.
In using Venn diagrams, our ultimate aim is to assign a number to each region. We always begin by first assigning the number to the innermost region and then working our way out.
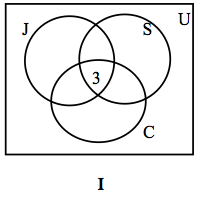 (a) | 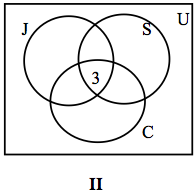 (b) | 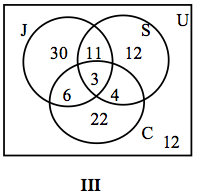 (c) |
We place a 3 in the innermost region of Figure 11.0a because it represents the number of people who participate in all three activities. Next we compute x, y and z.
Since 14 people jog and swim, x+3=14, or x=11.
The fact that 9 people jog and cycle results in y+3=9, or y=6.
Since 7 people swim and cycle, z+3=7, or z=4.
This information is depicted in Figure 11.0b.
Now we proceed to find the unknowns m, n and p.
Since 50 people jog, m+11+6+3=50, or m=30.
Thirty people swim, therefore, n+11+4+3=30, or n=12.
Thirty five people cycle, therefore, p+6+4+3=35, or p=22.
By adding all the entries in all three sets, we get a sum of 88. Since 100 people were surveyed, the number inside the universal set but outside of all three sets is 100 – 88, or 12.
In Figure 11.0c, the information is sorted out, and the questions can readily be answered.
The number of people who jog but do not swim or cycle is 30.
The number who take part in only one of these activities is 30+12+22=64.
The number of people who do not take part in any of these activities is 12.
In this chapter, we are trying to develop counting techniques that will be used in the Section 13.1 to study probability. One of the most fundamental of such techniques is called the Multiplication Axiom. Before we introduce the multiplication axiom, we first look at some examples.