Chapter 6. Internal Consistency Analysis: Part I

This chapter is published by NCPEA Press and is presented as an NCPEA/Connexions publication "print on demand book." Each chapter has been peer-reviewed, accepted, and endorsed by the National Council of Professors of Educational Administration (NCPEA) as a significant contribution to the scholarship and practice of education administration.
| John R. Slate is a Professor at Sam Houston State University where he teaches Basic and Advanced Statistics courses, as well as professional writing, to doctoral students in Educational Leadership and Counseling. His research interests lie in the use of educational databases, both state and national, to reform school practices. To date, he has chaired and/or served over 100 doctoral student dissertation committees. Recently, Dr. Slate created a website (Writing and Statistical Help) to assist students and faculty with both statistical assistance and in editing/writing their dissertations/theses and manuscripts. |
| Ana Rojas-LeBouef is a Literacy Specialist at the Reading Center at Sam Houston State University where she teaches developmental reading courses. Dr. LeBoeuf recently completed her doctoral degree in Reading, where she conducted a 16-year analysis of Texas statewide data regarding the achievement gap. Her research interests lie in examining the inequities in achievement among ethnic groups. Dr. Rojas-LeBouef also assists students and faculty in their writing and statistical needs on the Writing and Statistical Help website.
|
In this set of steps and screenshots, you will be presented with information regarding how to determine the internal consistency (i.e., reliability) of scores derived from a larger set of variables. In particular, this chapter follows up on the factor analysis chapter. The subscales that were determined to constitute Factor 1 and the subscales that were determined to comprise Factor 2 will be the variables used in this chapter to ascertain the extent to which they constitute internally consistent factors. For more detailed information regarding internal consistency analysis, readers are referred to the Hyperstats Online Statistics Textbook at
http://davidmlane.com/hyperstat/
; to the
Electronic Statistics Textbook
(2011) at
http://www.statsoft.com/textbook/
; or to Andy Field’s (2009) Discovering Statistics Using SPSS at
http://www.amazon.com/Discovering-Statistics-Introducing-Statistical-Method/dp/1847879071/ref=sr_1_1?s=books&ie=UTF8&qid=1304967862&sr=1-1
Conducting an internal consistency analysis is usually part of a set of statistical analyses. Its purpose is to determine score reliability and not to determine whether groups differ on some variable. As such, internal consistency analysis precedes the use of inferential statistical procedures.
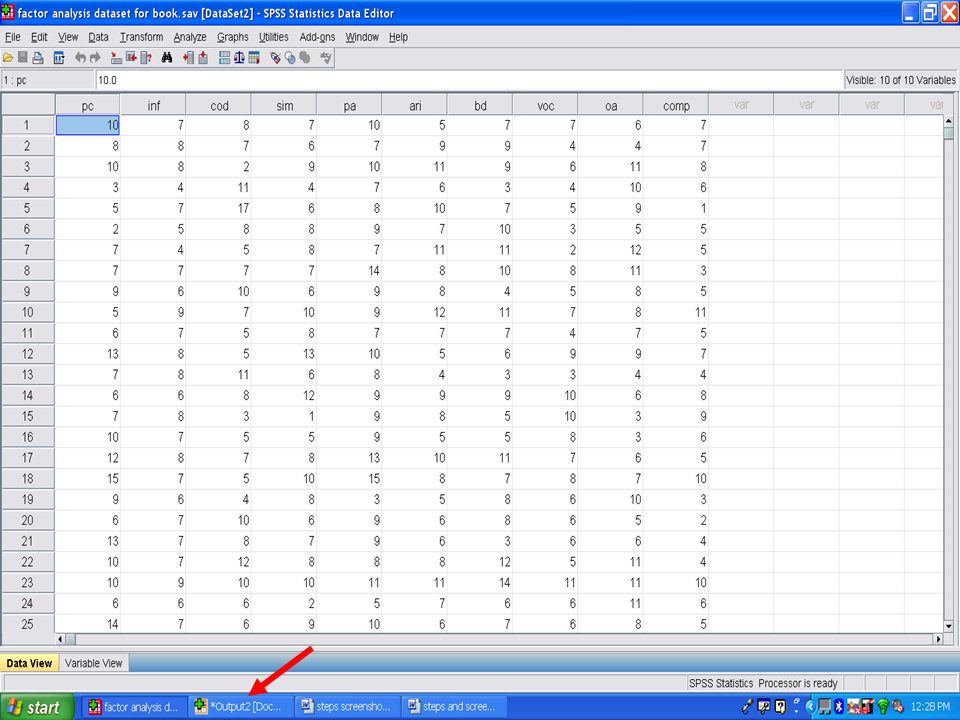
Have your data set pulled into SPSS-PC. In this data set, we have the same 10 subscales used in the factor analysis chapter.

Click on Analyze
Click on Scale
Click on Reliability Analysis

Using the information from the chapter on factor analysis, we want to determ
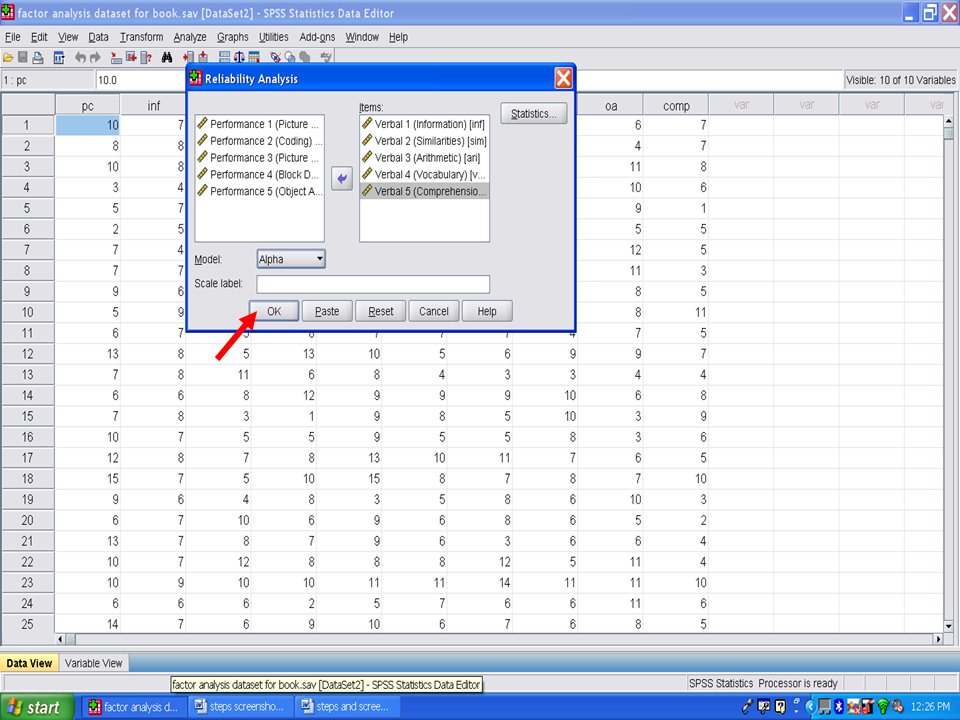
ine the internal consistency of: Verbal 1 (Information), Verbal 2 (Similarities), Verbal 3 (Arithmetic), Verbal 4 (Vocabulary), and Verbal 5 (Comprehension). Click on each of these variables and send each to the box labeled Items.
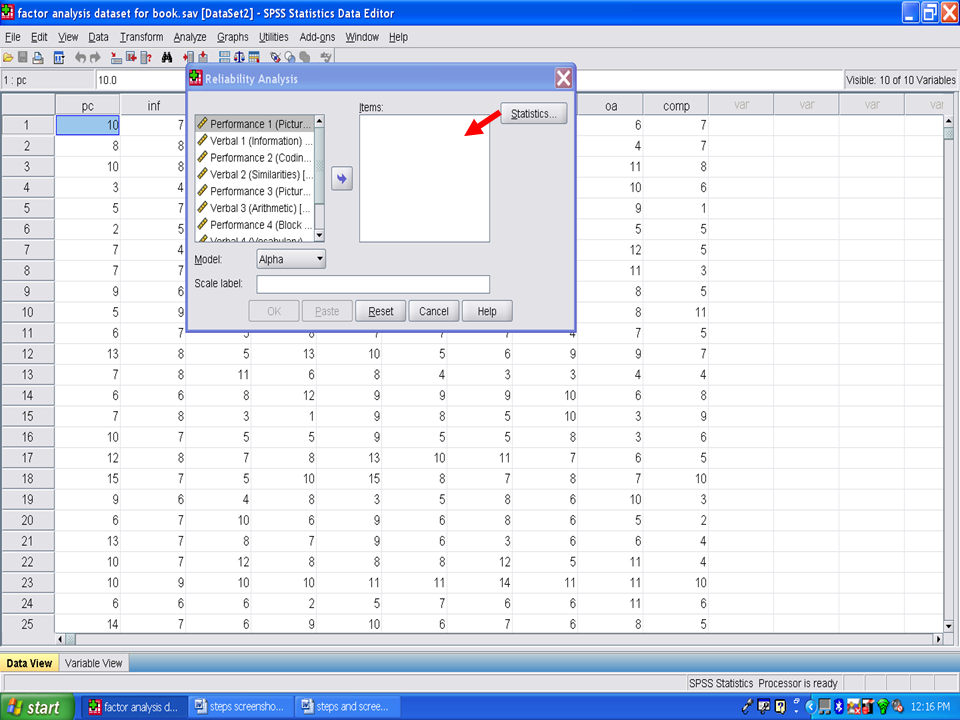
Now your screen should look like the one below.
Click on Statistics.
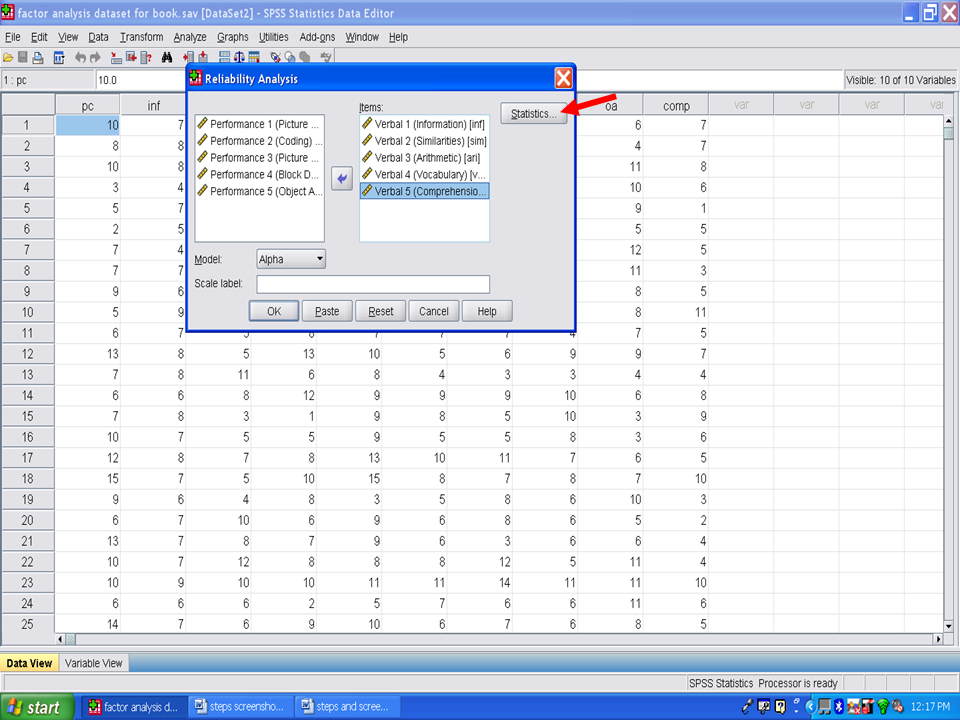
After clicking on Statistics, the following screen should appear.
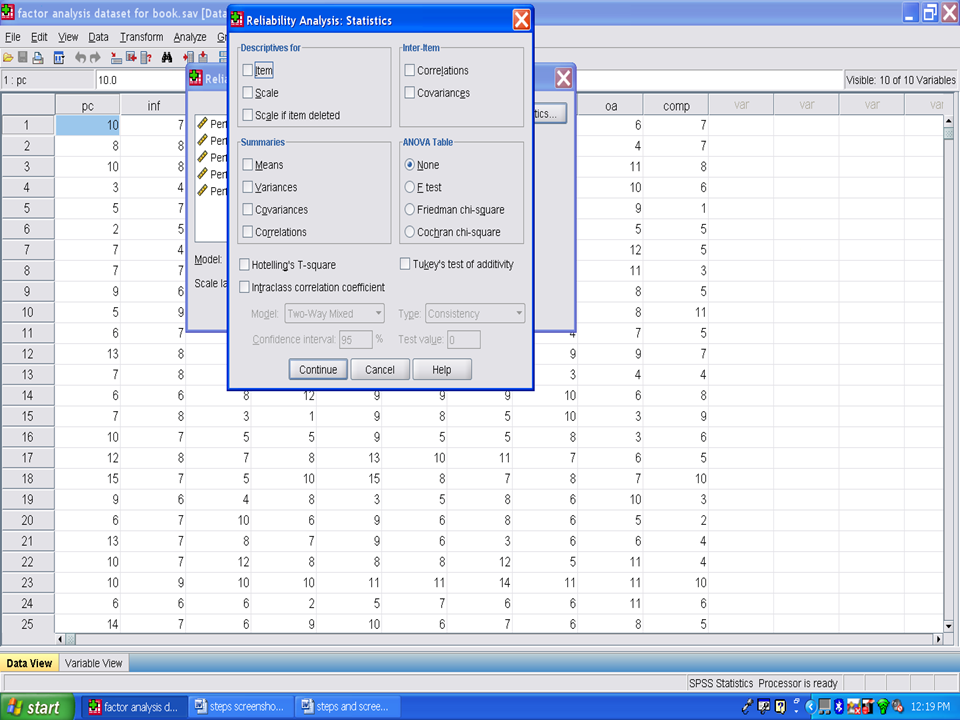
Click under Descriptives on
Item
Scale
Scale if item deleted
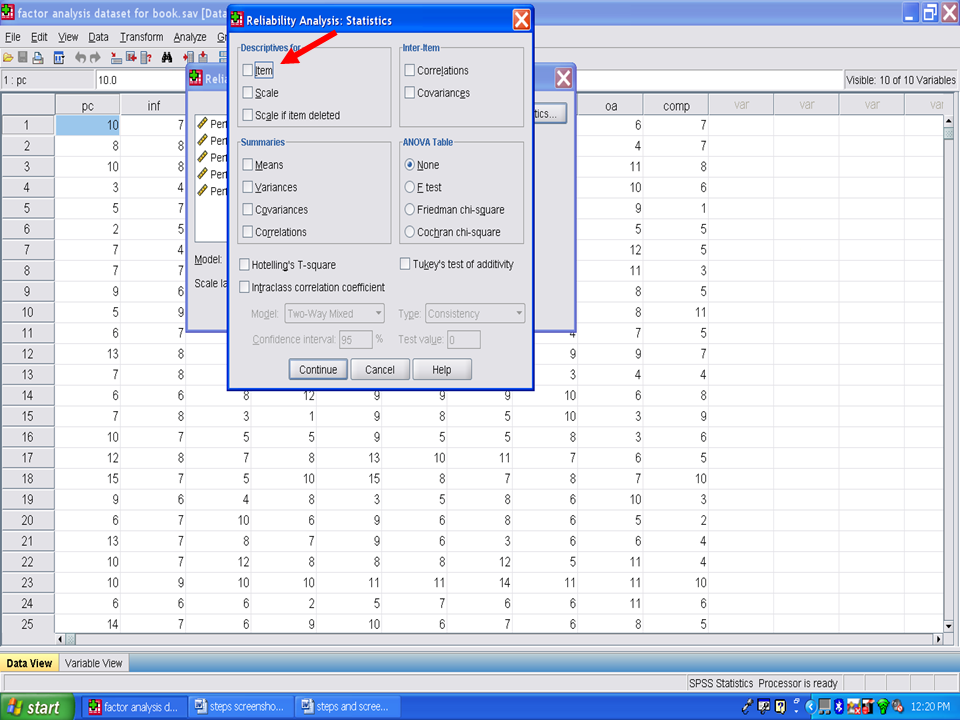
After you have clicked on the three items under Descriptives, next click under Summaries on
Means
Variances
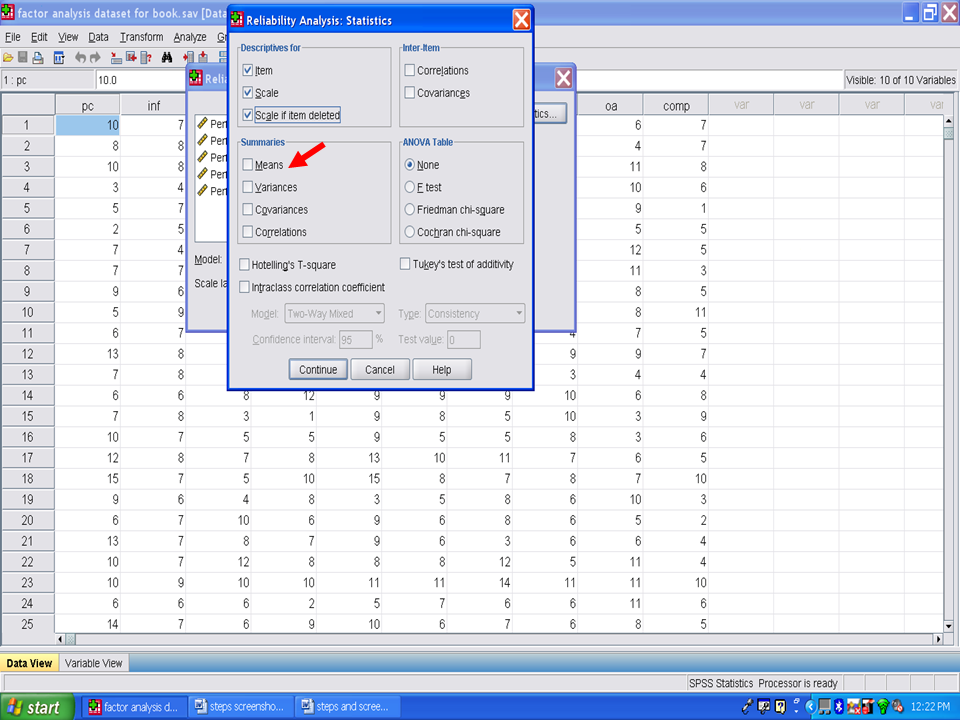
Now that you have clicked on Means and Variances under Summaries, your screen should now look like the screen below. Next, under Inter-Item, click on
Correlations
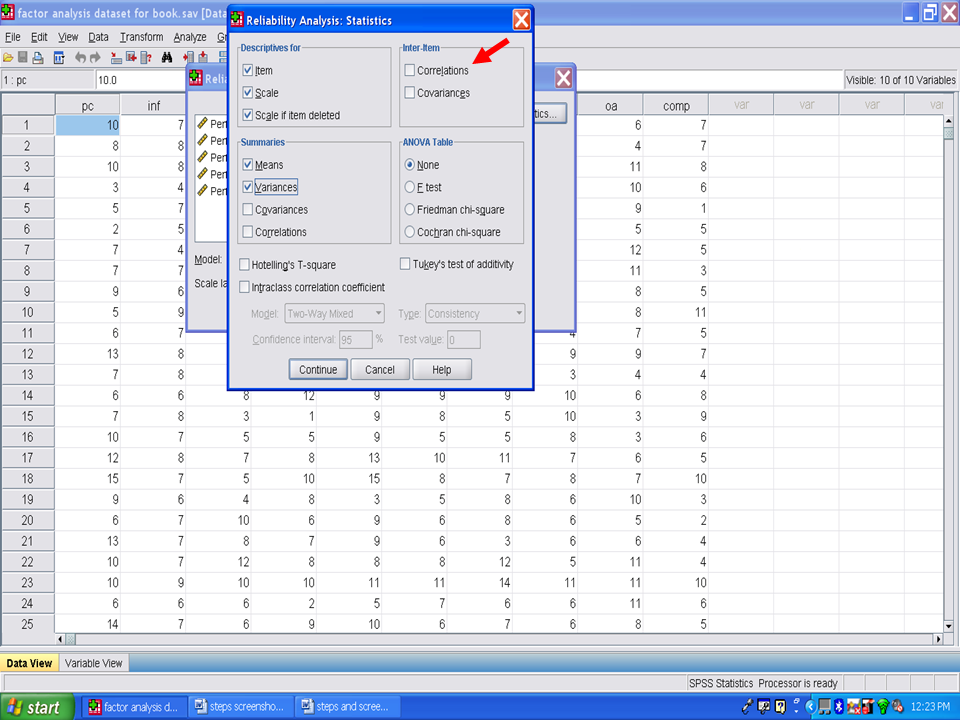
After you check to verify that your screen looks the one below, then you may click on Continue.
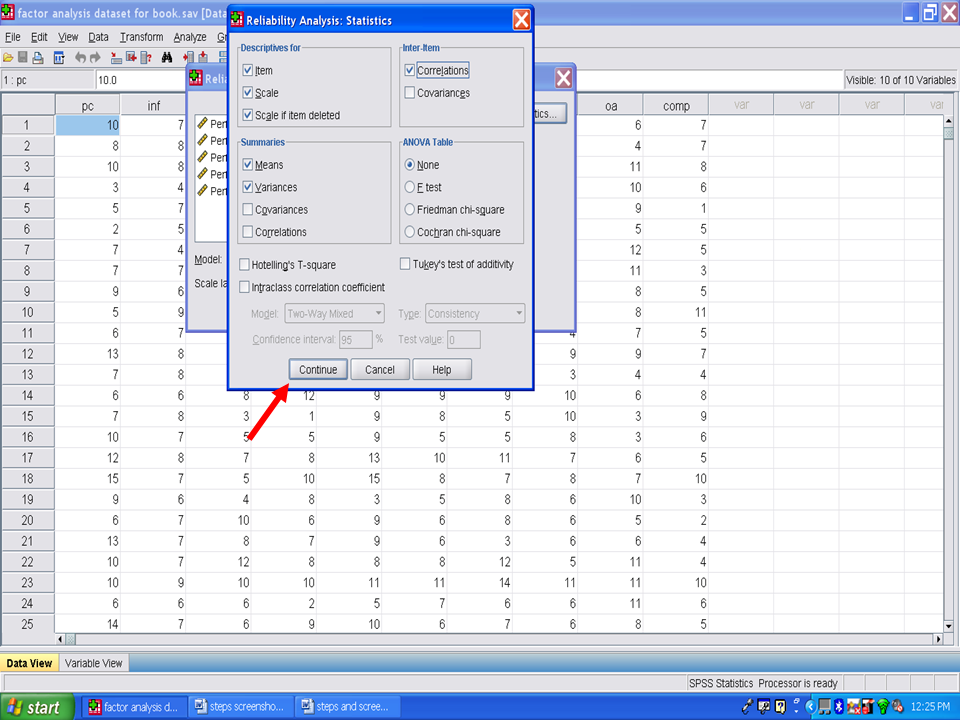
Next click on OK.
SPSS should send you to the Output screen. If not, click on the Output icon at the bottom of your screen.
