
This chapter is published by NCPEA Press and is presented as an NCPEA/Connexions publication "print on demand book." Each chapter has been peer-reviewed, accepted, and endorsed by the National Council of Professors of Educational Administration (NCPEA) as a significant contribution to the scholarship and practice of education administration.
| John R. Slate is a Professor at Sam Houston State University where he teaches Basic and Advanced Statistics courses, as well as professional writing, to doctoral students in Educational Leadership and Counseling. His research interests lie in the use of educational databases, both state and national, to reform school practices. To date, he has chaired and/or served over 100 doctoral student dissertation committees. Recently, Dr. Slate created a website (Writing and Statistical Help) to assist students and faculty with both statistical assistance and in editing/writing their dissertations/theses and manuscripts. |
| Ana Rojas-LeBouef is a Literacy Specialist at the Reading Center at Sam Houston State University where she teaches developmental reading courses. Dr. LeBoeuf recently completed her doctoral degree in Reading, where she conducted a 16-year analysis of Texas statewide data regarding the achievement gap. Her research interests lie in examining the inequities in achievement among ethnic groups. Dr. Rojas-LeBouef also assists students and faculty in their writing and statistical needs on the Writing and Statistical Help website. |
In this chapter, we will show you how to enter data from a survey into SPSS. You can either develop your SPSS data file straight from your survey and then enter in data once your surveys have been completed. Or, you can develop your SPSS data file from your completed surveys. In this set of steps and screenshots, we will assume that you have completed surveys on hand. In our example, we will use the following survey:

You will note that this survey consists of five items, with a 4-point Likert format. We have assigned a value of 1 to Strongly Agree; a value of 2 to Agree; a value of 3 to Disagree; and a value of 4 to Strongly Disagree. You could, of course, reverse these values so that Strongly Disagree could be a 1.

Open up your SPSS so that you have a blank data screen in front of you. Click on the Variable View button at the bottom left of your screen.

We are now at the screen where we can enter in variable names for our survey items. For simplicity, we will refer to the first Survey Item as S1; the second Survey Item as S2; and so on. We will click in the first cell, row one, under Name.

Doing this permits us to type in S1 for our first Survey Item.

After typing in S1, then move your cursor to the column that reads Label. Once you have typed in S1 and moved your cursor out of that cell, SPSS will fill in the default values for that variable. This variable is a numeric one. In the column marked Label, we will place in the survey item from the Word file.

If you have the survey in Word format, have your Word file opened and copy the first survey item.

Go back to your SPSS datafile and paste the copied survey item in the Label column, first row.

Repeat this process for S2.

Go to your Word file and copy the second survey item.

Paste it in the Label column for the second row.

You would repeat the same process for the remaining survey items. After this work, your file would look like the following.

Now we need to type in the values for the 4-point Likert scale. To do so, click on the first cell in row one under the column heading, Values. See the arrow below.

When you click in this cell, three dots appear. These three dots indicate that a screen is hidden beneath this one. Click on the three dots.
After clicking on the three dots, the following screen will appear.
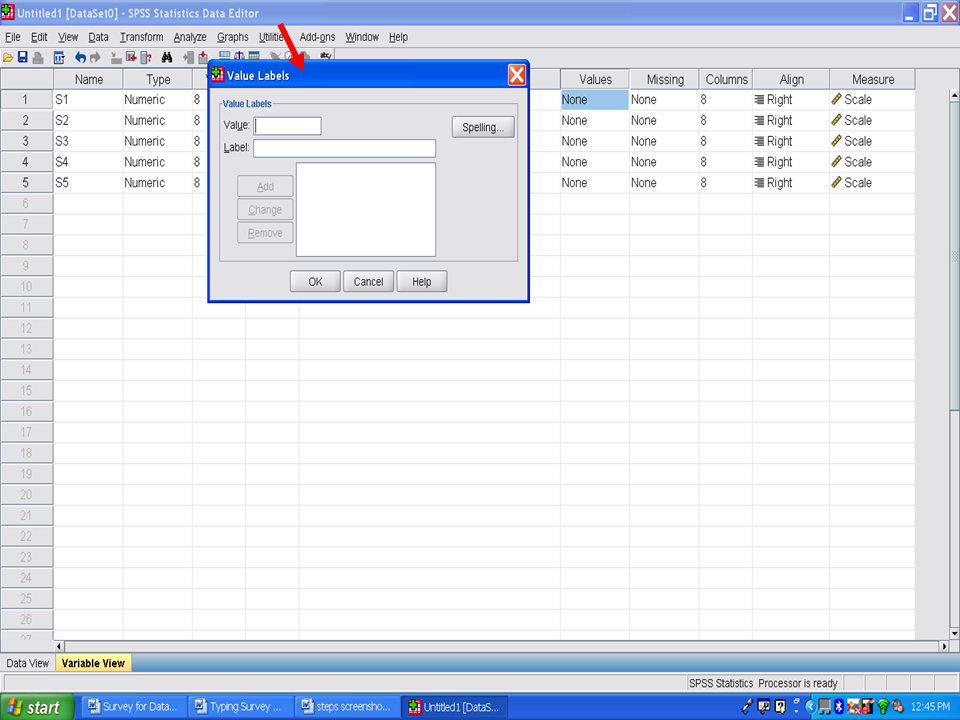
In this screen, we will type in a numeric value in the Value cell and the Likert-format response label in the Label cell. That is, our four values are 1, 2, 3, and 4, which correspond to a Strongly Agree, Agree, Disagree, and Strongly Disagree. Refer back to the survey which we are using for this example.
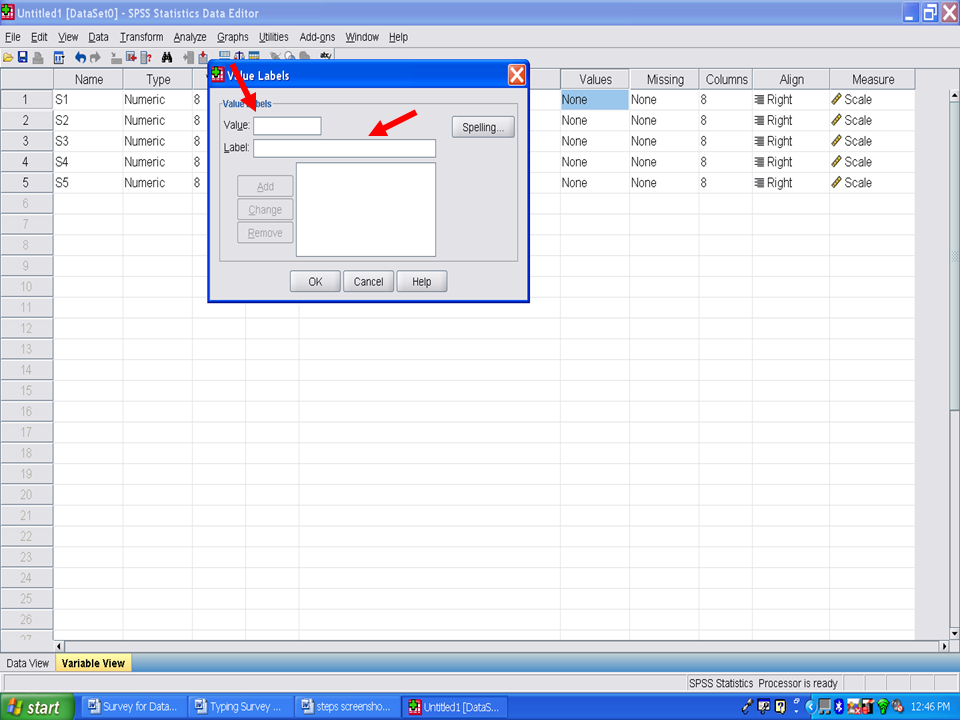
After typing in a 1 in Value and Strongly Agree in Label, we will now click on Add.

After clicking on Add, your screen should look like the one below.

We will repeat this process for 2 Agree; 3 Disagree; and 4 Strongly Disagree. Your screen should look like the one below.

Now click on OK.

Your screen should now look like the following one. The 4-point Likert scale has been successfully entered for the first survey item. Now we will copy it and paste it one at a time for the other four survey items.

Right mouse click on the cell that you just completed.
Copy.

Move to the second cell in the Label column.
Paste.

Your screen will now have that cell filled in with the same information that you typed in for survey item one. Repeat this paste process for survey items 3, 4, and 5.

Your screen will now look like the following one. All of your survey items are present and typed out in the Label column. All of the numeric values for participants’ responses are labeled in the Values column. Remember to save your file.

You have now successfully created a SPSS dataset for your survey.