Calculating Advanced Statistics: Part I by Ana Rojas-LeBouef, John R. Slate - HTML preview

PLEASE NOTE: This is an HTML preview only and some elements such as links or page numbers may be incorrect.
Download the book in PDF, ePub, Kindle for a complete version.

Chapter 2Selecting a Single Group for Statistical Analysis

ncpealogo.gif

This chapter is published by NCPEA Press and is presented as an NCPEA/Connexions publication "print on demand book." Each chapter has been peer-reviewed, accepted, and endorsed by the National Council of Professors of Educational Administration (NCPEA) as a significant contribution to the scholarship and practice of education administration.

John R. Slate is a Professor at Sam Houston State University where he teaches Basic and Advanced Statistics courses, as well as professional writing, to doctoral students in Educational Leadership and Counseling. His research interests lie in the use of educational databases, both state and national, to reform school practices. To date, he has chaired and/or served over 100 doctoral student dissertation committees. Recently, Dr. Slate created a website (Writing and Statistical Help) to assist students and faculty with both statistical assistance and in editing/writing their dissertations/theses and manuscripts.
Ana Rojas-LeBouef is a Literacy Specialist at the Reading Center at Sam Houston State University where she teaches developmental reading courses. Dr. LeBoeuf recently completed her doctoral degree in Reading, where she conducted a 16-year analysis of Texas statewide data regarding the achievement gap. Her research interests lie in examining the inequities in achievement among ethnic groups. Dr. Rojas-LeBouef also assists students and faculty in their writing and statistical needs on the Writing and Statistical Help website.
Theodore B. Creighton, is a Professor at Virginia Tech and the Publications Director for NCPEA Publications, the Founding Editor of Education Leadership Review, and the Senior Editor of the NCPEA Connexions Project.
Brad E. Bizzell, is a recent graduate of the Virginia Tech Doctoral Program in Educational Leadership and Policy Studies, and is a School Improvement Coordinator for the Virginia Tech Training and Technical Assistance Center. In addition, Dr. Bizzell serves as an Assistant Editor of the NCPEA Connexions Project in charge of technical formatting and design.
Janet Tareilo, is a Professor at Stephen F. Austin State University and serves as the Assistant Director of NCPEA Publications. Dr. Tareilo also serves as an Assistant Editor of the NCPEA Connexions Project and as a editor and reviewer for several national and international journals in educational leadership.

In this chapter, we will provide you with the steps and screenshots to select out a single group for analysis. In this circumstance, your data set consists of data from multiple groups. Your interest, however, is in obtaining statistics on only one specific group. Using SPSS for all students will only provide you with statistical information for all of the individuals, aggregated across all of the groups. It will not give you statistical information on a specific group. If you follow the steps and screenshots we provide, you can have SPSS generate statistics for the group of students in which you are interested.

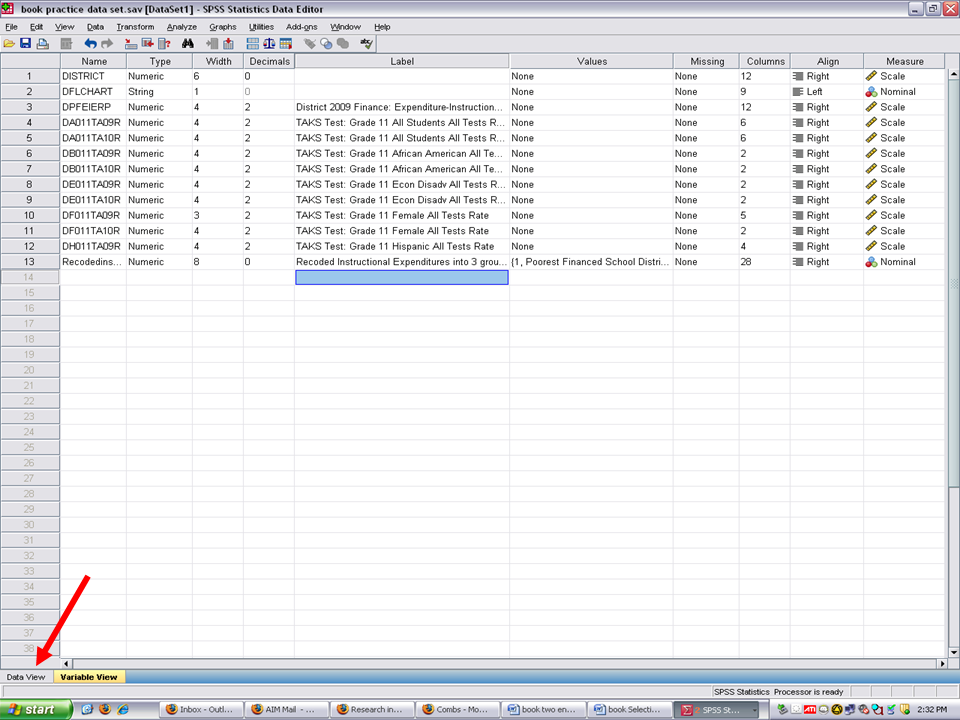
This step presupposes that you have already opened up SPSS and your data file. Click on Variable View in the data window.

1.1.png

Identify your grouping variable. It should be a nominal measure (see the far right column). In the example below, Recoded Instructional Expenditures into 3 groups, is our grouping variable.

Click on the Values cell for this grouping variable. Three dots will appear. These three dots indicate that a screen is hidden underneath this cell.

1.3.png

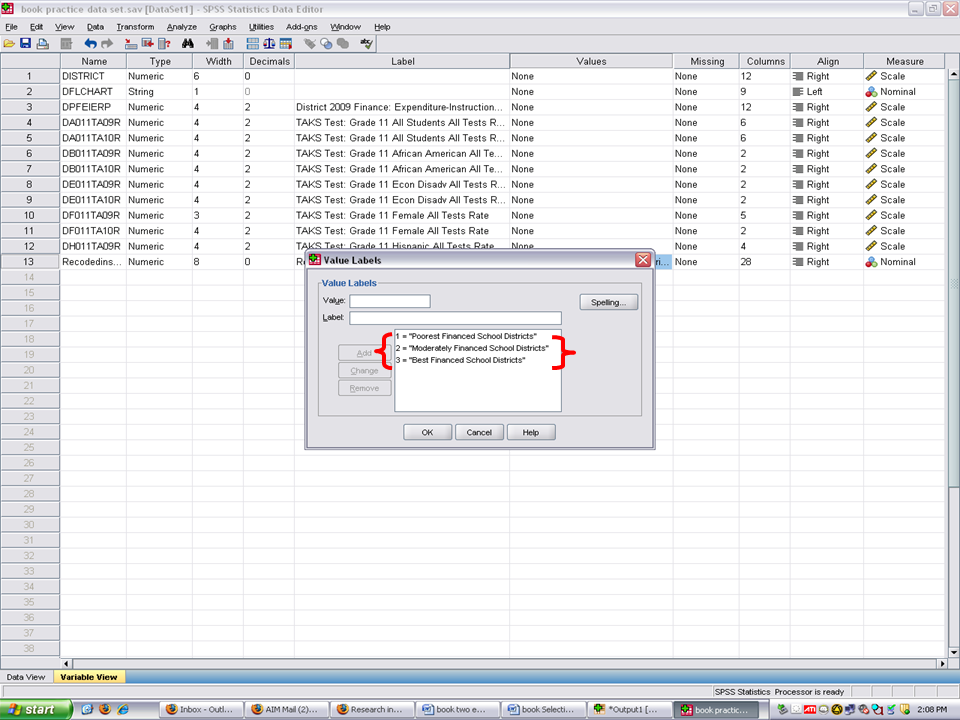
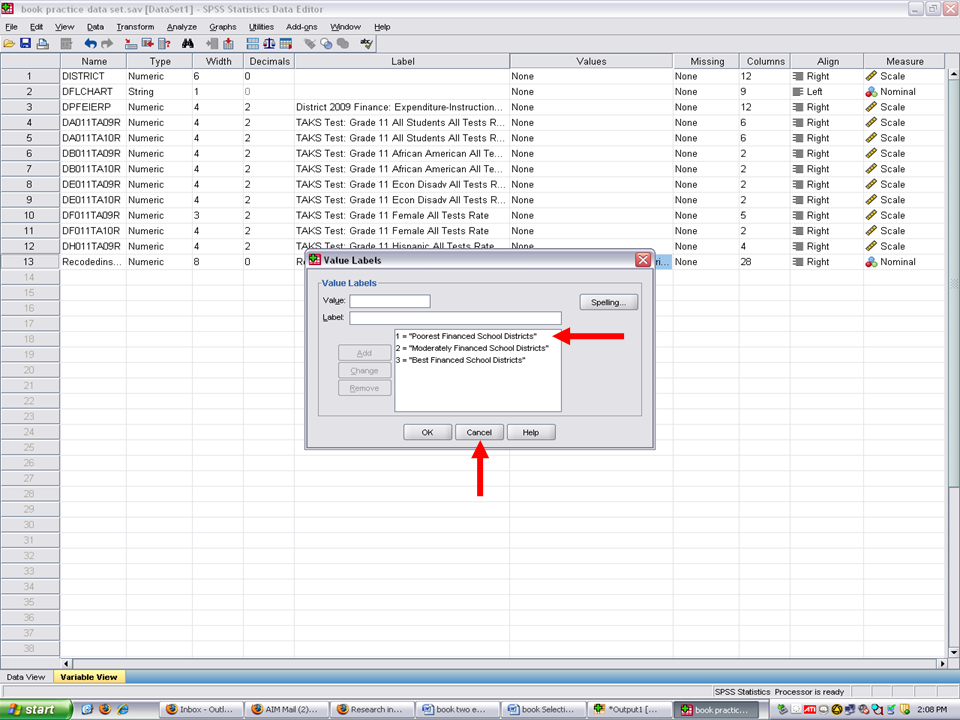
Clicking on the three dots will reveal the hidden screen. After clicking on the three dots, this screen appears and shows us the names of the three groups.
1.4.png

For purposes of this chapter, we will have statistics calculated for group 1 which is the Poorest Financed School Districts. Now that we know that this group is numbered as group 1, we will cancel out of this screen.
1.5.png

Click on the data view screen.

1.6.png

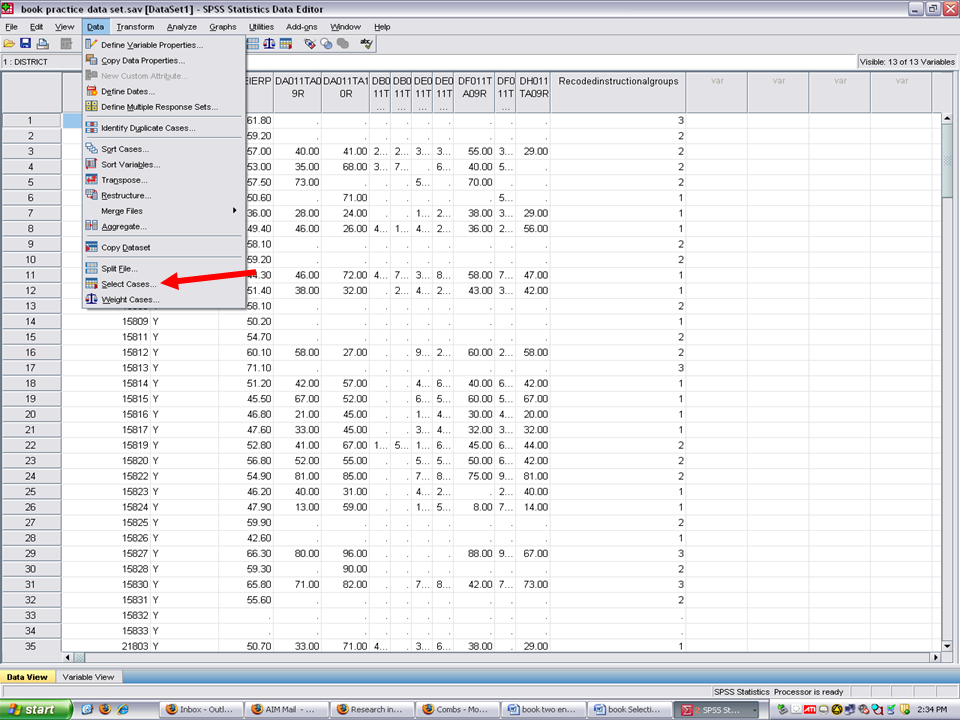
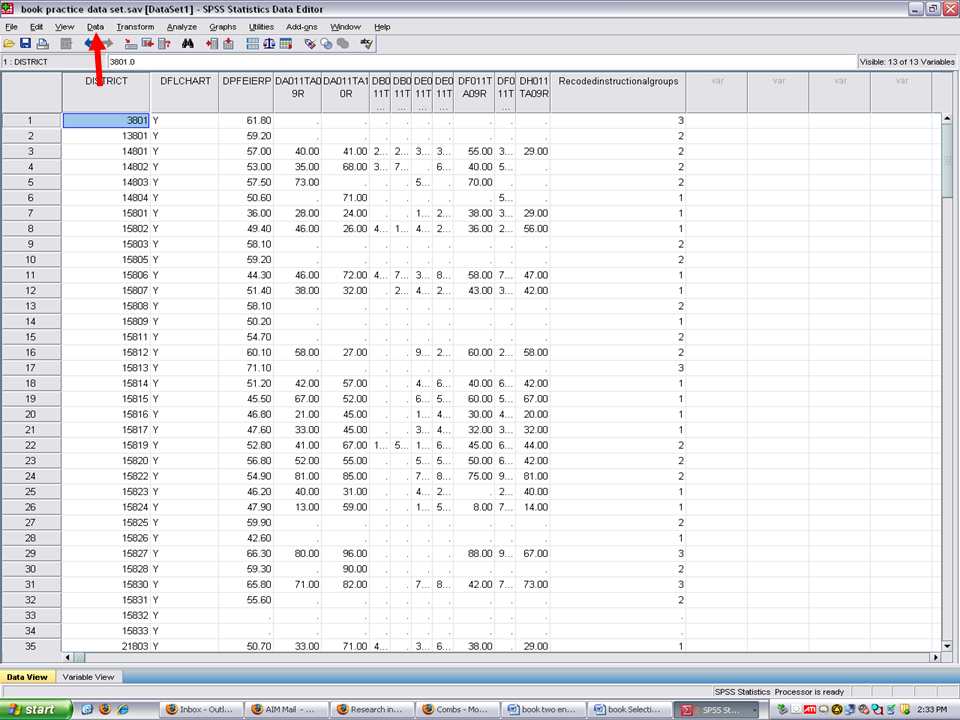
We are now at the data screen. To select out a specific group on which to have statistics calculated, click on Data.

√ Data
1.7.png

√ Select Cases

1.9.png

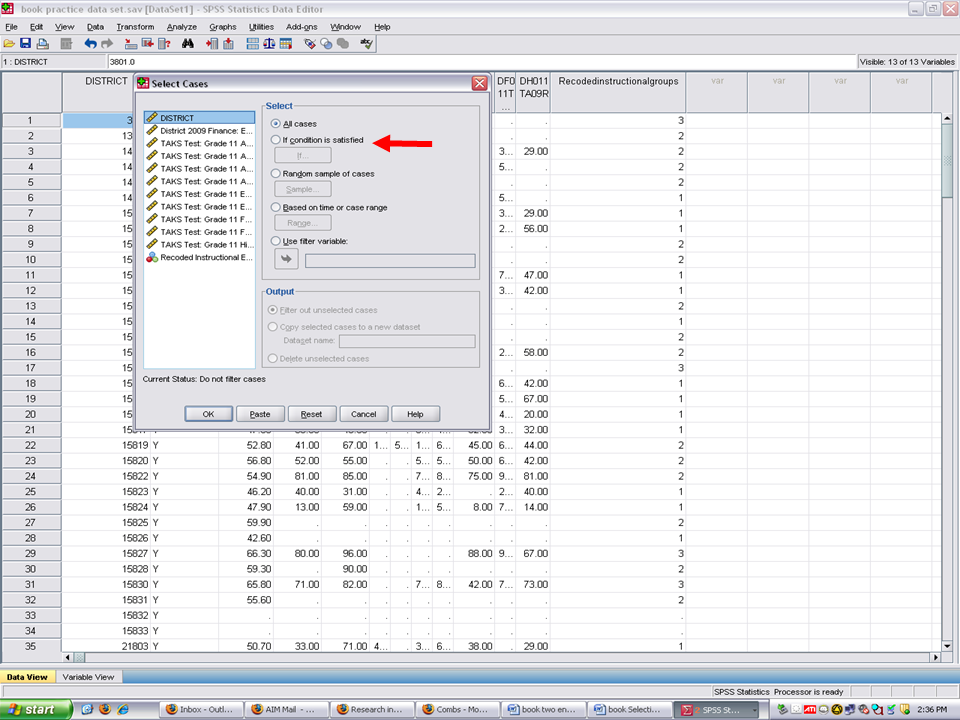
You will note that All Cases is checked. You should click on the

√ If Condition is satisfied
1.10.png

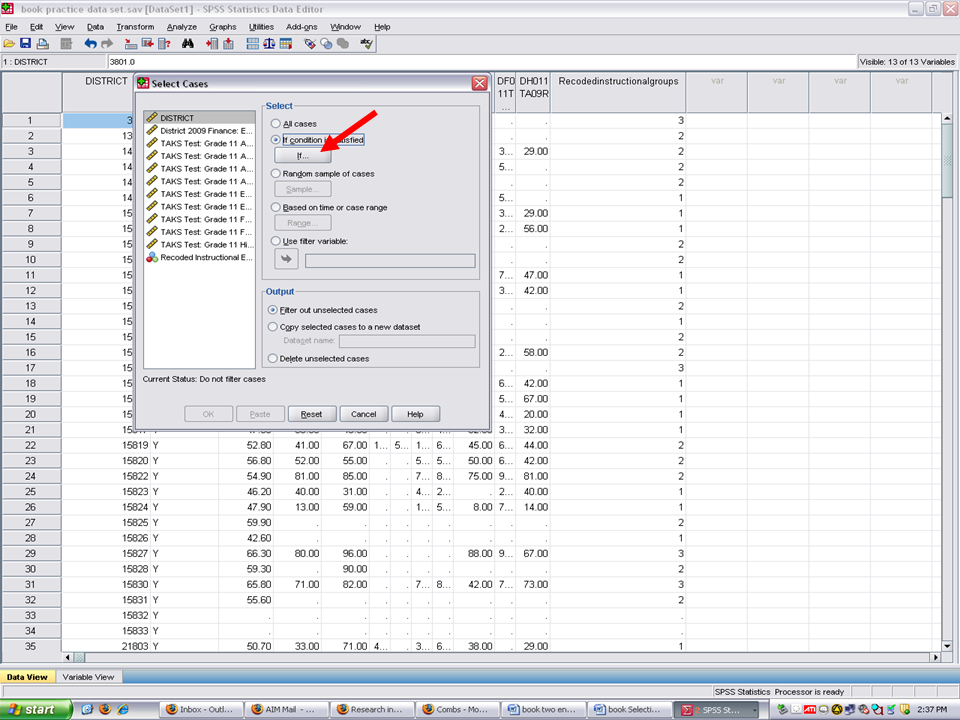
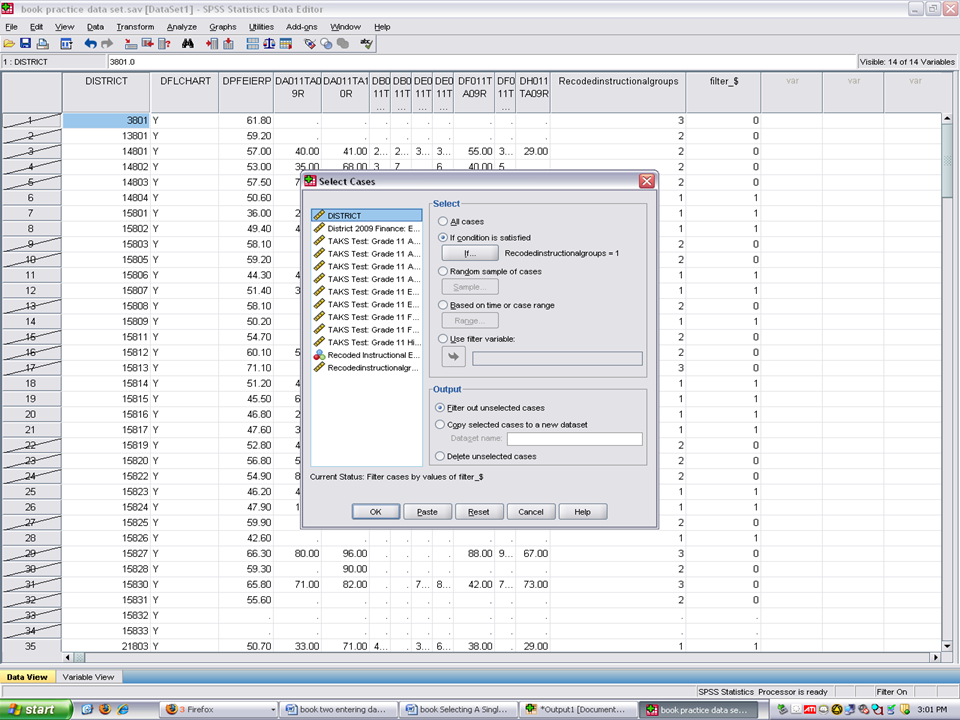
When you click on the If Condition is satisfied, the If button then becomes activated.

√ Click on the If, under the If Condition is satisfied.
1.11.png

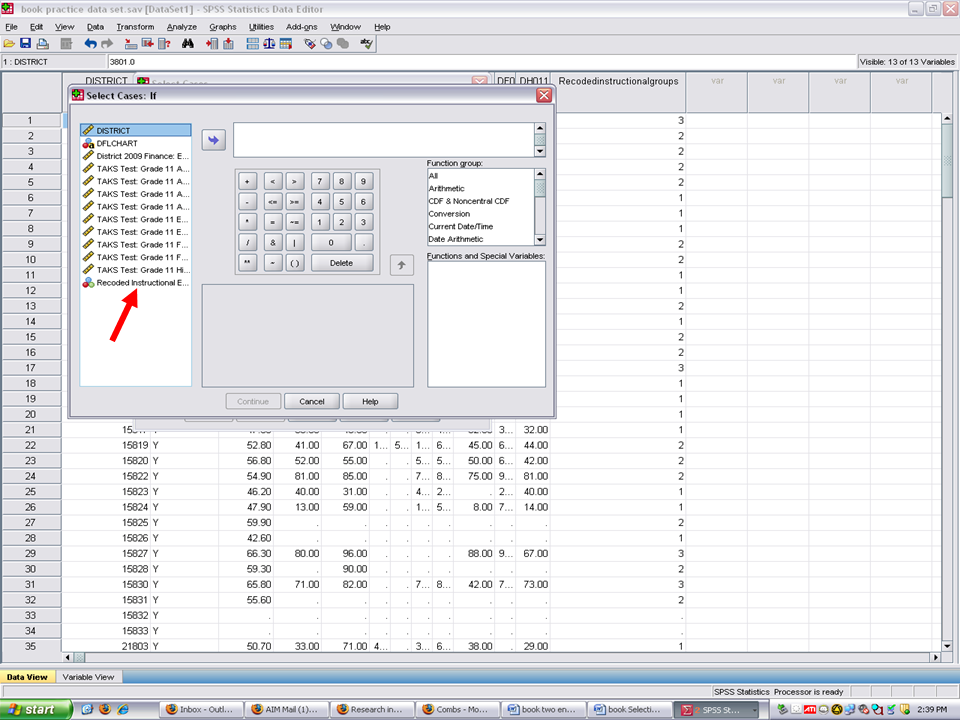
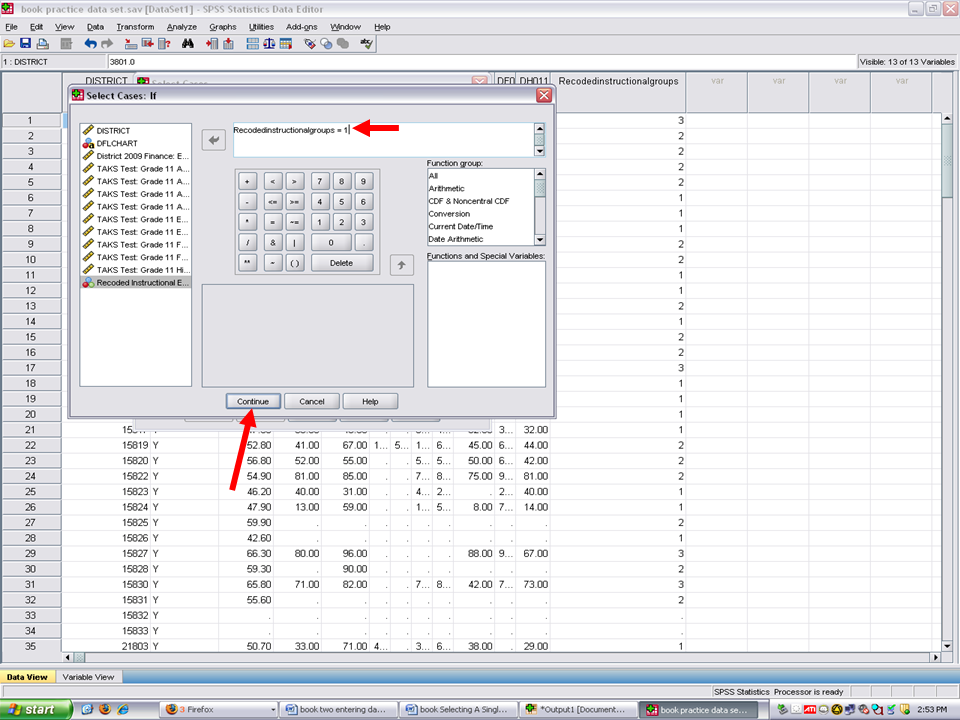
Clicking on the If opens up this screen. We will have to send over the name of the grouping variable, Recoded Instructional Expenditures into 3 groups.
1.12.png

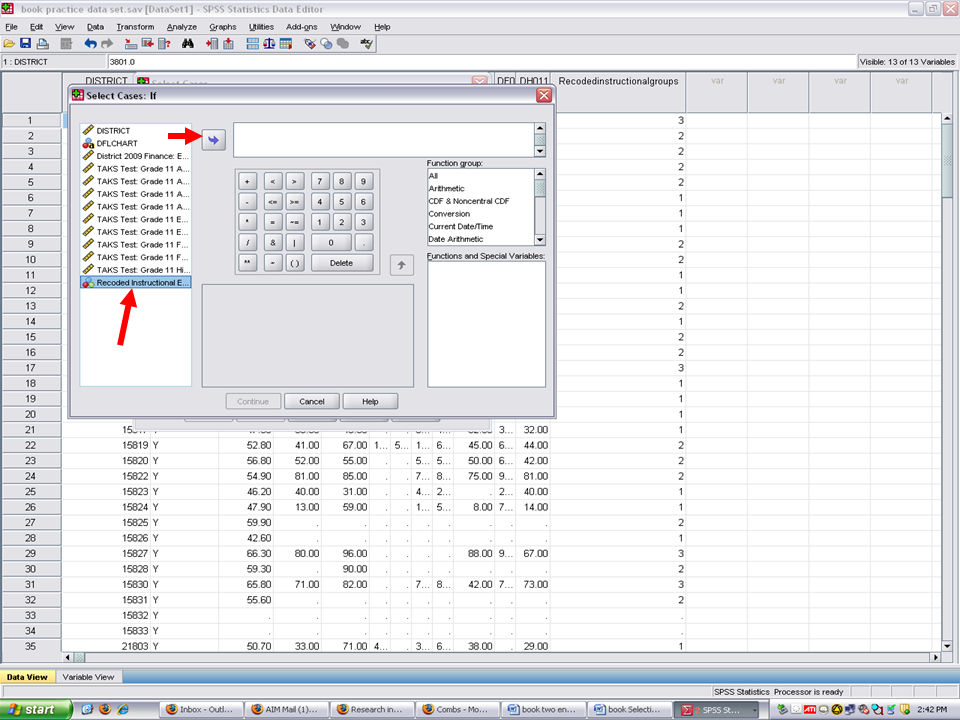
√ Click on the Recoded Instructional Expenditures into 3 groups variable and then on the right arrow key.
1.13.png

Now the grouping variable has been placed into the empty rectangle, we can now begin the process of selecting the specific group of interest.

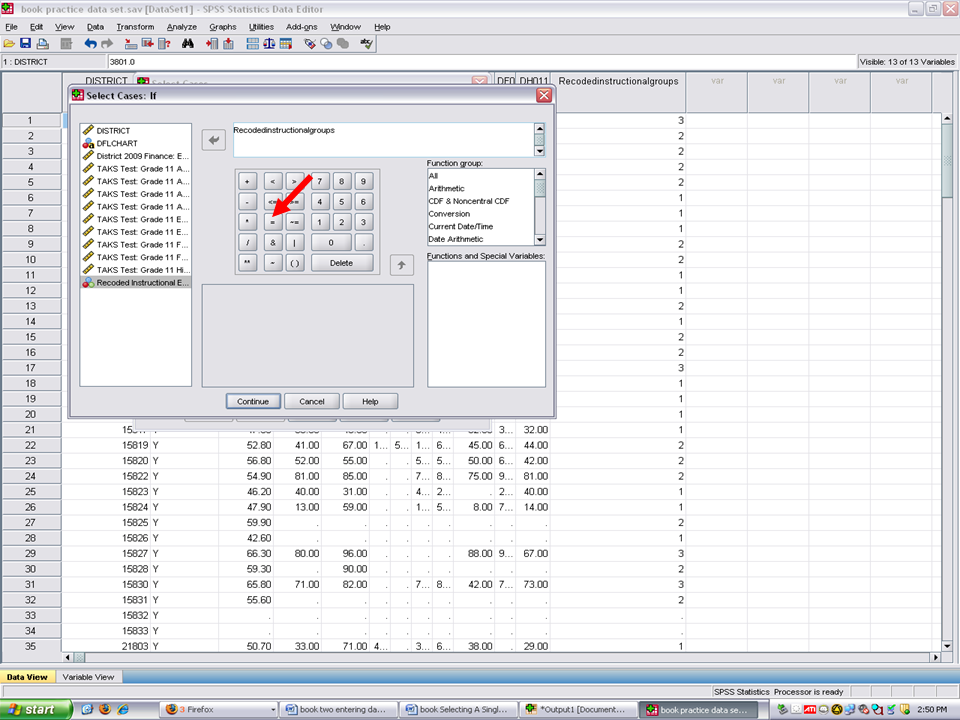
√ Click on the = sign
1.14.png

After clicking on the = sign, it appears to the right of the grouping variable in the rectangle.

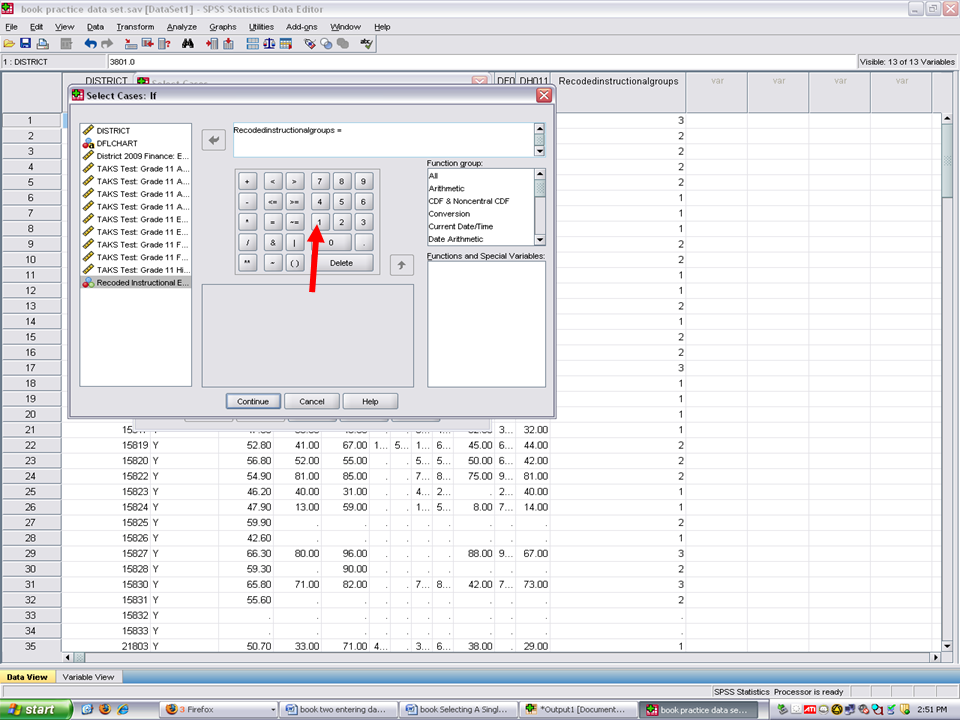
√ Click on the number of the group on which you want to calculate statistics. In our case, we want to use group # 1 (remember our previous steps in identifying the Poorest Financed School Districts.

In this case we will click on 1.
1.15.png

We have now informed SPSS that we want to select out only those Poorest Financed School Districts for statistical analyses.
1.16.png

√ Click on Continue above.

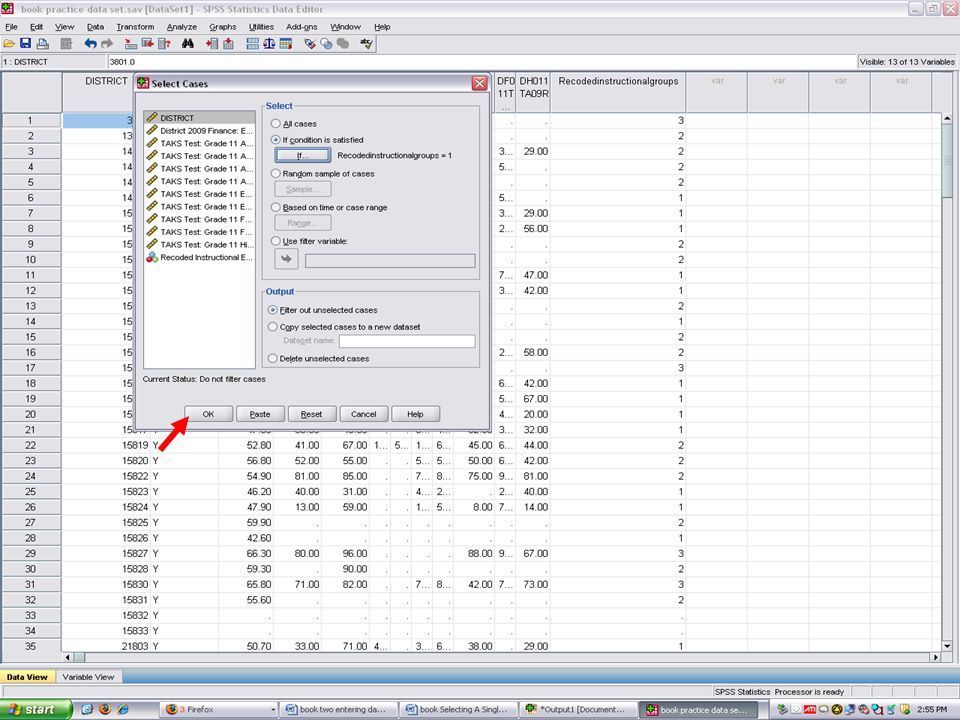
√ After clicking on continue, this screen appears.

√ Click on OK.
1.17.png

You will now be sent to your output file. Click on the data file and data view.

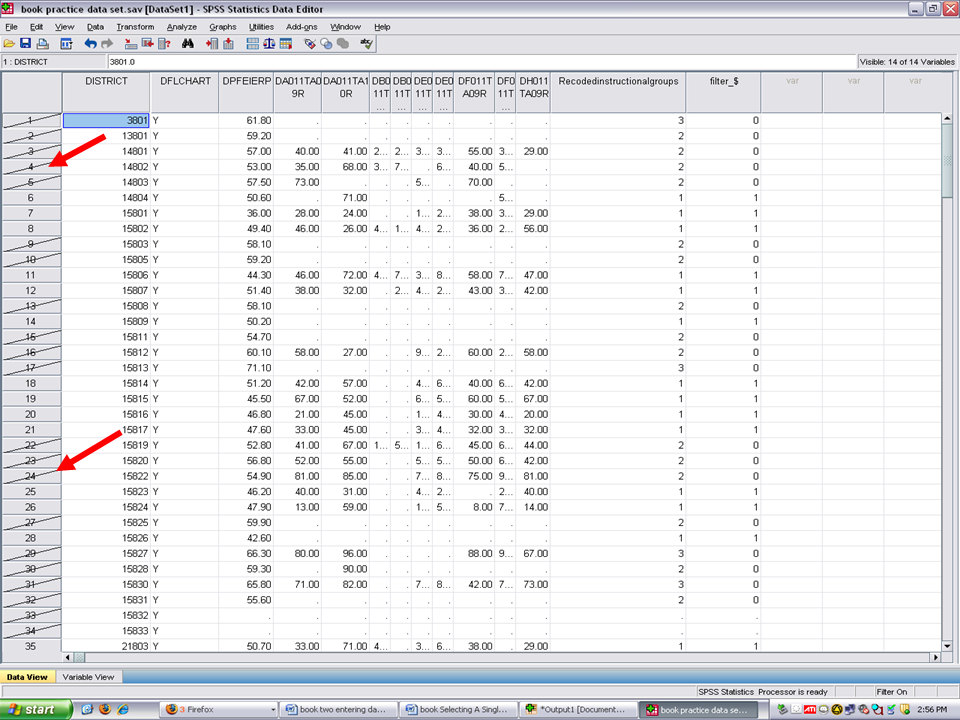
In the data view screen, you will note that the Moderately Financed School Districts and the Best Financed School Districts have been marked through. The only active cases on which SPSS will calculate statistics are the Poorest Financed School Districts (group = 1).
1.18.png

At this point, you can calculate descriptive statistics or other analyses. Such calculations will only have the Poorest Financed School Districts in them.

After obtaining the calculations of interest for this group, if you wish to select the Best Financed School Districts, you would follow the steps above in selecting group 1. Replace group = 1, with group = 2.

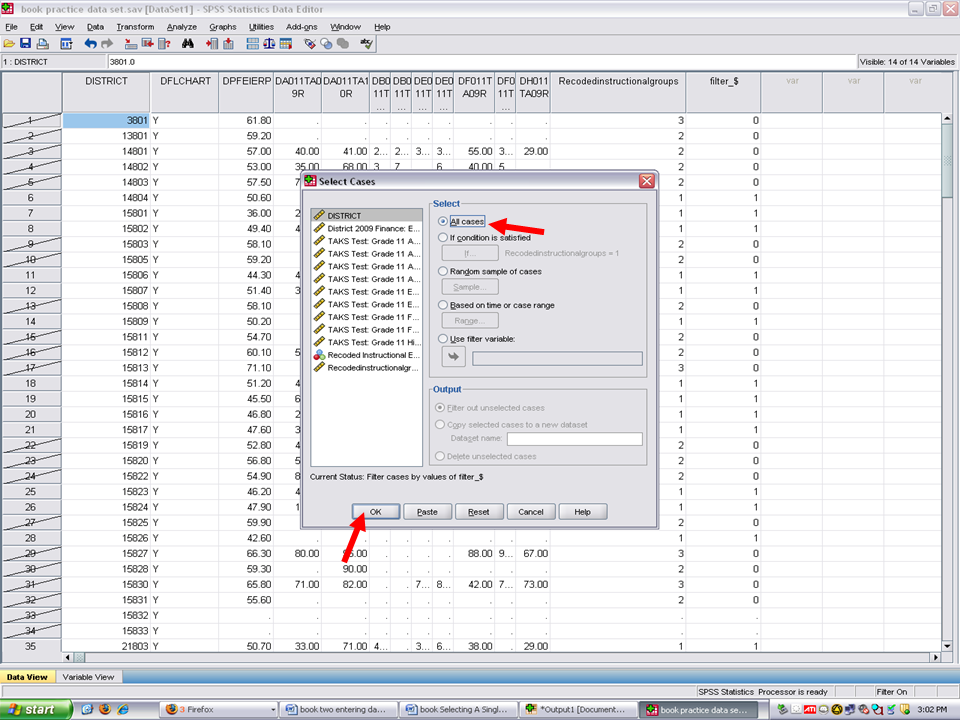
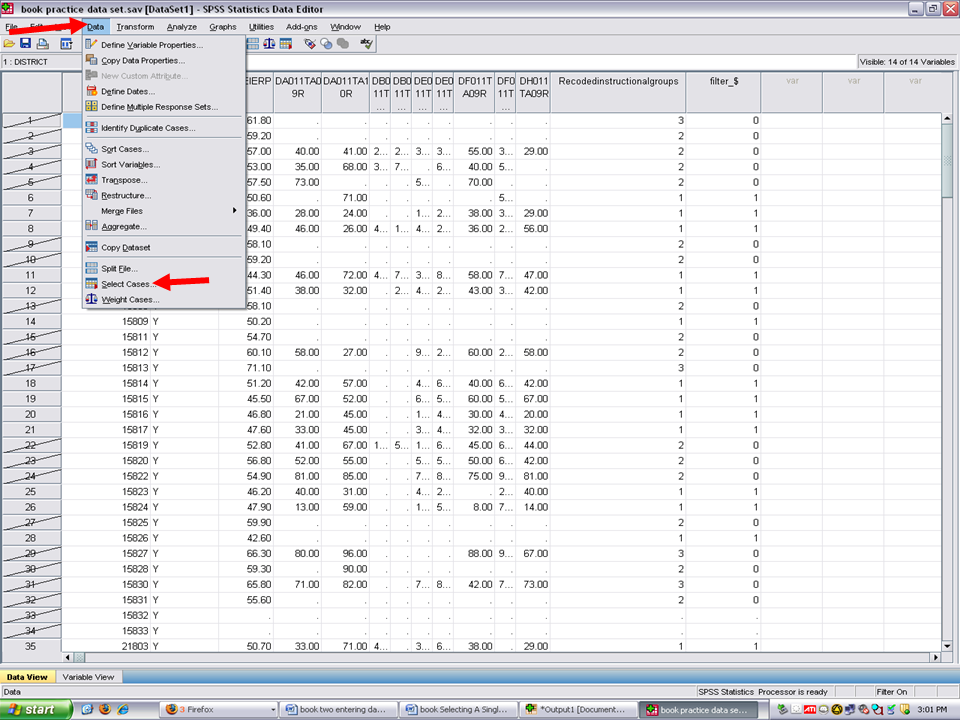
If you intend to analyze all cases (i.e., have all three groups back together), follow these steps.

√ Click on Data

√ Click on Select Cases
1.19.png

After clicking on Select Cases, this screen will appear.
1.20.png

√ Click on All Cases

1.21.png

√ Click on OK above.

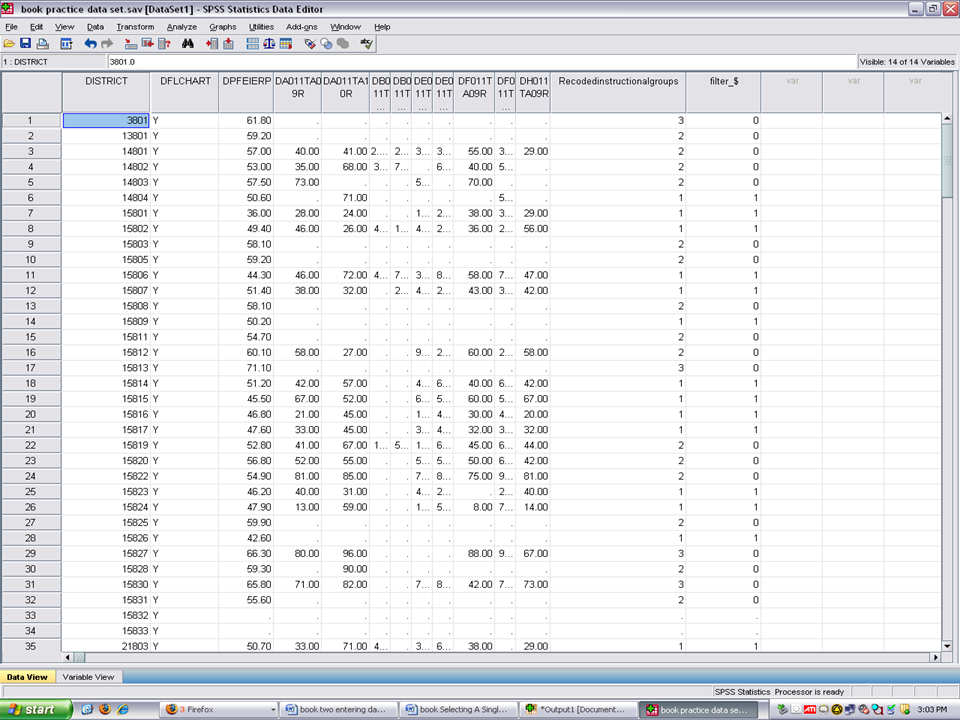
You will now note that no cases are crossed through. SPSS will now use all three groups in its analyses.
1.22.png

Solutions