
This chapter is published by NCPEA Press and is presented as an NCPEA/Connexions publication "print on demand book." Each chapter has been peer-reviewed, accepted, and endorsed by the National Council of Professors of Educational Administration (NCPEA) as a significant contribution to the scholarship and practice of education administration.
| John R. Slate is a Professor at Sam Houston State University where he teaches Basic and Advanced Statistics courses, as well as professional writing, to doctoral students in Educational Leadership and Counseling. His research interests lie in the use of educational databases, both state and national, to reform school practices. To date, he has chaired and/or served over 100 doctoral student dissertation committees. Recently, Dr. Slate created a website (Writing and Statistical Help) to assist students and faculty with both statistical assistance and in editing/writing their dissertations/theses and manuscripts. |
| Ana Rojas-LeBouef is a Literacy Specialist at the Reading Center at Sam Houston State University where she teaches developmental reading courses. Dr. LeBoeuf recently completed her doctoral degree in Reading, where she conducted a 16-year analysis of Texas statewide data regarding the achievement gap. Her research interests lie in examining the inequities in achievement among ethnic groups. Dr. Rojas-LeBouef also assists students and faculty in their writing and statistical needs on the Writing and Statistical Help website. |
| Theodore B. Creighton, is a Professor at Virginia Tech and the Publications Director for NCPEA Publications, the Founding Editor of Education Leadership Review, and the Senior Editor of the NCPEA Connexions Project. |
| Brad E. Bizzell, is a recent graduate of the Virginia Tech Doctoral Program in Educational Leadership and Policy Studies, and is a School Improvement Coordinator for the Virginia Tech Training and Technical Assistance Center. In addition, Dr. Bizzell serves as an Assistant Editor of the NCPEA Connexions Project in charge of technical formatting and design. |
| Janet Tareilo, is a Professor at Stephen F. Austin State University and serves as the Assistant Director of NCPEA Publications. Dr. Tareilo also serves as an Assistant Editor of the NCPEA Connexions Project and as a editor and reviewer for several national and international journals in educational leadership. |
These procedures are to be followed when your data are already entered into SPSS and when you have values that you need to either remove or to recode into different values.
Work from the Data View window.

After clicking on the Data View button, your screen should look like the screen below in that you are looking at data.

Identify the variable in which values are present that you want to recode.
In our case, we want to recode the values for Question One below.

Identify the values within this variable that you wish to recode. You may need to run the frequencies procedure to list out all of the values present for the variable of interest.
√ Click on Analyze
√ Click on Descriptive Statistics
√ Click on Frequencies

Highlight the variable on which you will request frequencies so that you can then determine the values that you will need to change/recode. In this example, we are using Survey Question One.

√ Click on the arrow in the middle to send over the Survey Question One variable.

Because we want a listing of the values present for this variable, Survey Question One, we will click on OK.
Go to the output screen. For this example, our output looks like the following. Survey Question One has five different values (i.e., 1, 2, 3, 4, 5). The value of 1 only occurred 6 times. These values could represent a 5-point Likert format of 1 = Strongly Disagree, 2 = Disagree, 3 = Neutral/Undecided, 4 = Agree, and 5 = Strongly Agree. [Note. Readers are referred to a separate chapter on typing in survey data with appropriate labeling.]

Based upon our frequencies, we will combine values 1 and 2 into a Disagreement category and 4 and 5 into an Agreement category.
√ Click on Transform.

You now have an option to Recode Into Same Variables or Recode Into Different Variables. We recommend that you recode into different variables so that the data present in the variable of Question One is left untouched.

When you click on Recode Into Different Variables, you will then see this screen.

Highlight the variable on which you will be recoding the values. In this example, our variable is Survey Question One. After highlighting it, click on the arrow to send it to the Input Variable – Output Variable box.

Click under the Output Variable where Name is present.

Now type in a new name for the variable you will be creating. Remember that the information in Survey Question One is being recoded from 5 separate values into 3 values. We encourage you to type Recoded in front of the new variable name.
The name, RecodedQuestionOne, will be the name of our new variable. After typing in the name, click on Change.

After clicking on Change, the name for the new variable that is being created appears in the Numeric Variable – Output Variable box.

Now click on Old and New Values. This is where the values will be recoded.

This screen will then appear.

Click on Old Value and the rectangle underneath it becomes activated.

Now we will begin recoding the values for this variable. Type a 1 in the Old Value box and a 1 in the New Value box.

Click on Add. This then moves the 1 in the Old Value and 1 in the New Value into the larger box.

Now type a 2 in Old Value and a 1 in New Value. When this process is completed, SPSS will merge all values of a 1 and all values of a 2 into a 1 category.

Click on Add. The Old Value of 2 and the New Value of 1 now appear in the larger box.

Type a 3 in Old Value and a 2 in New Value.

Click on Add. The Old Value of 3 and the New Value of 2 have been added into the larger box.

Type a 4 in Old Value and a 3 in New Value. Then click on Add

The Old Value of 4 and the New Value of 3 have now been added to the larger box.

Finally, type 5 in the Old Value box and 3 into the New Value box. Click on Add

Now all 5 values in the Survey Question One variable are present in the Old – New box below. They will be recoded into 3 values.

Click on Continue.

Click on OK. SPSS will then generate a new variable for you, RecodedQuestionOne.

The newly created variable, RecodedQuestionOne, will be added as the last variable in your dataset.
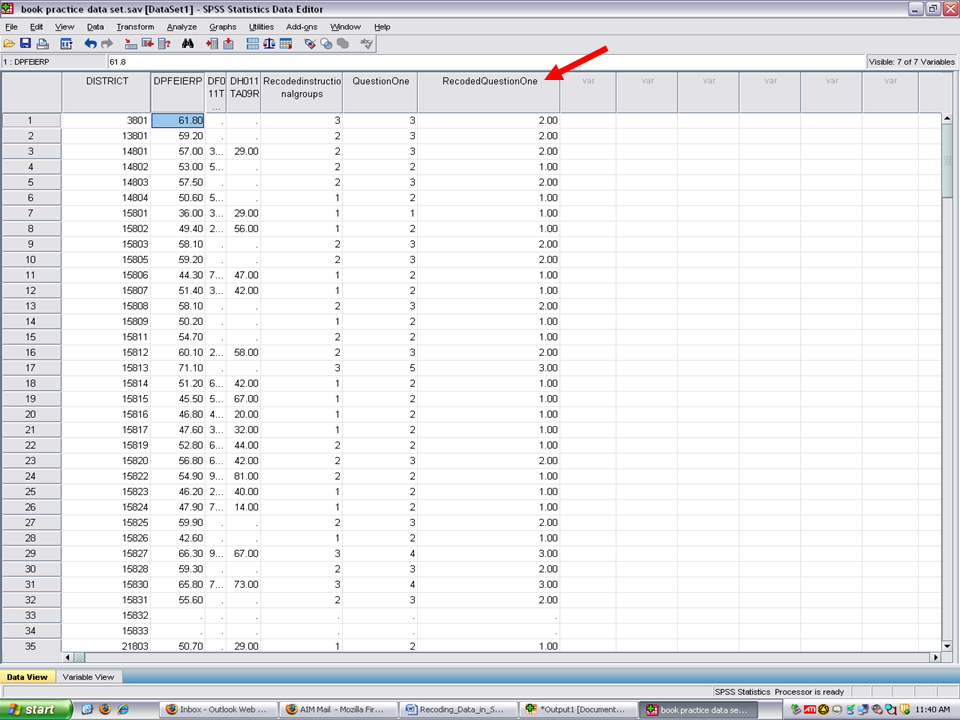
You have generated a new variable, one not in your original dataset, that contains 3 values, instead of the 5 values in the Question One variable.