Chapter 9. Multiple Regression: Part I

This chapter is published by NCPEA Press and is presented as an NCPEA/Connexions publication "print on demand book." Each chapter has been peer-reviewed, accepted, and endorsed by the National Council of Professors of Educational Administration (NCPEA) as a significant contribution to the scholarship and practice of education administration.
| John R. Slate is a Professor at Sam Houston State University where he teaches Basic and Advanced Statistics courses, as well as professional writing, to doctoral students in Educational Leadership and Counseling. His research interests lie in the use of educational databases, both state and national, to reform school practices. To date, he has chaired and/or served over 100 doctoral student dissertation committees. Recently, Dr. Slate created a website (Writing and Statistical Help) to assist students and faculty with both statistical assistance and in editing/writing their dissertations/theses and manuscripts. |
| Ana Rojas-LeBouef is a Literacy Specialist at the Reading Center at Sam Houston State University where she teaches developmental reading courses. Dr. LeBoeuf recently completed her doctoral degree in Reading, where she conducted a 16-year analysis of Texas statewide data regarding the achievement gap. Her research interests lie in examining the inequities in achievement among ethnic groups. Dr. Rojas-LeBouef also assists students and faculty in their writing and statistical needs on the Writing and Statistical Help website.
|
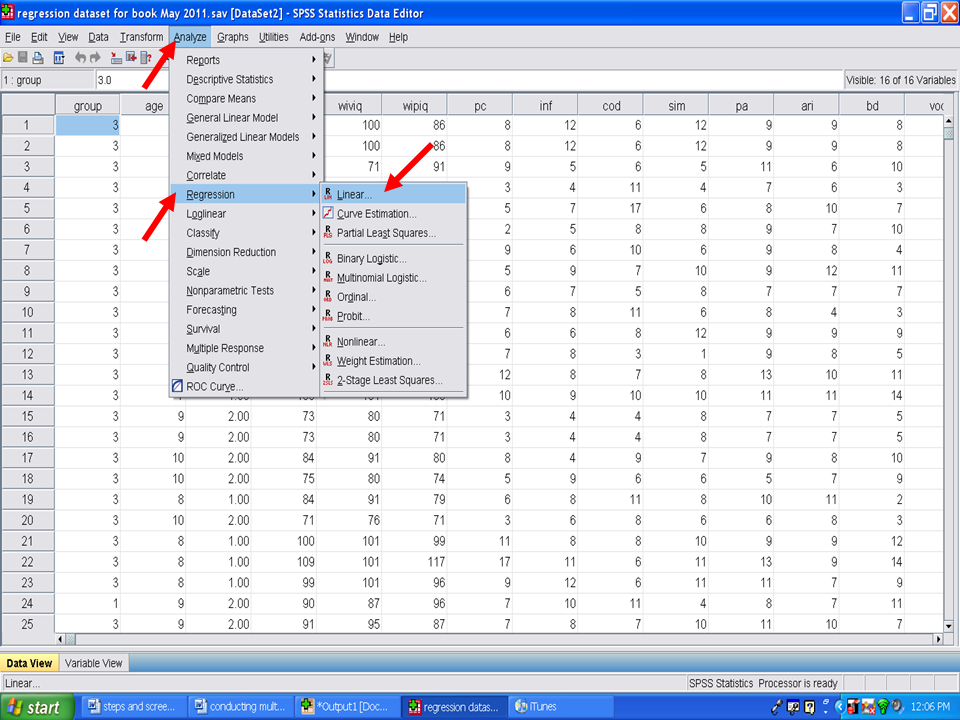
From the data screen, click on
√ Analyze
√ Regression
√ Linear
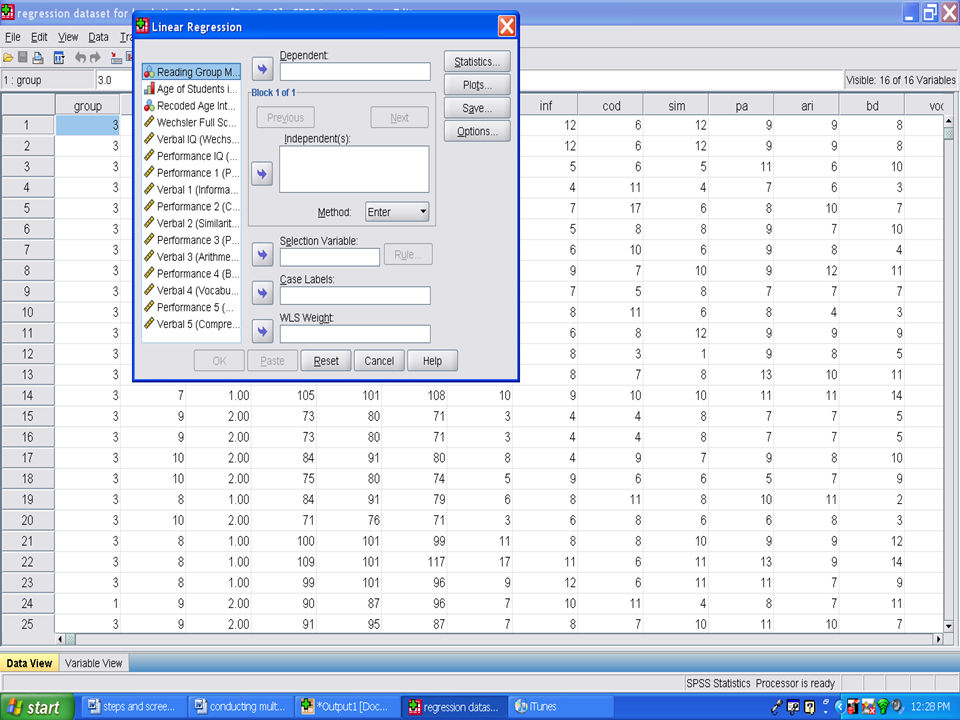
Your screen should now look like the one below. We will send the dependent variable, the one we are trying to predict, to the Dependent box. Click on Wechsler Full Scale IQ 3 and send it to the Dependent box.
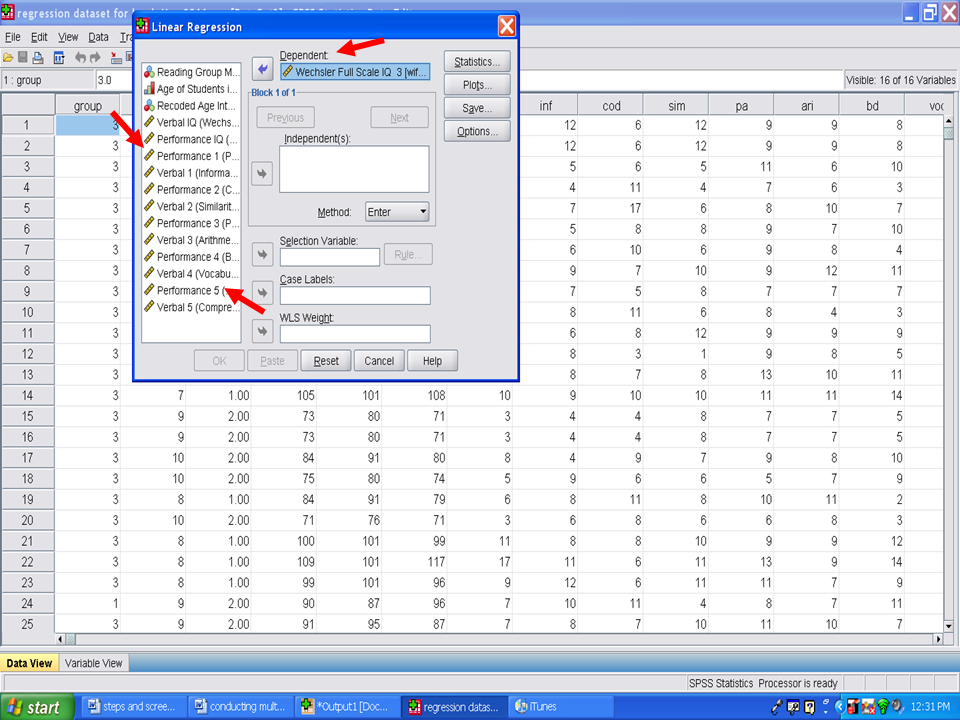
Your screen should now look like the following one. Next we will place all of the independent variables in the Independent(s) box. I this example, remember that we are using Performance 1 through Verbal 5.
After you have placed all 10 of these variables in the Independent(s) box, your screen will look like the following one.
Next we will click on Method and change it from the default of Enter to Stepwise.
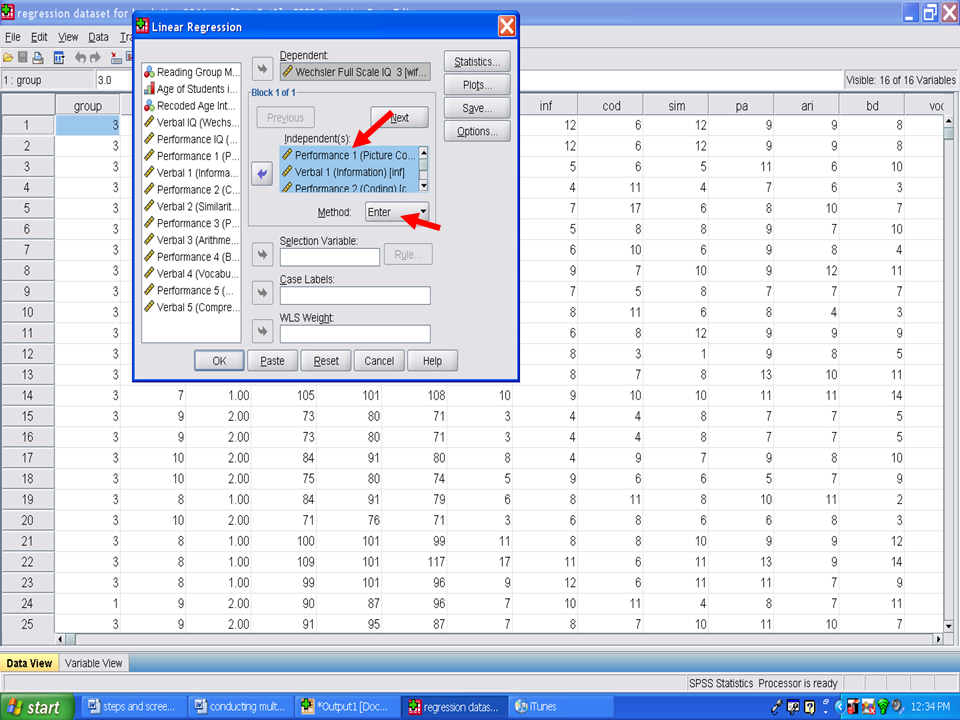
Click on Stepwise.
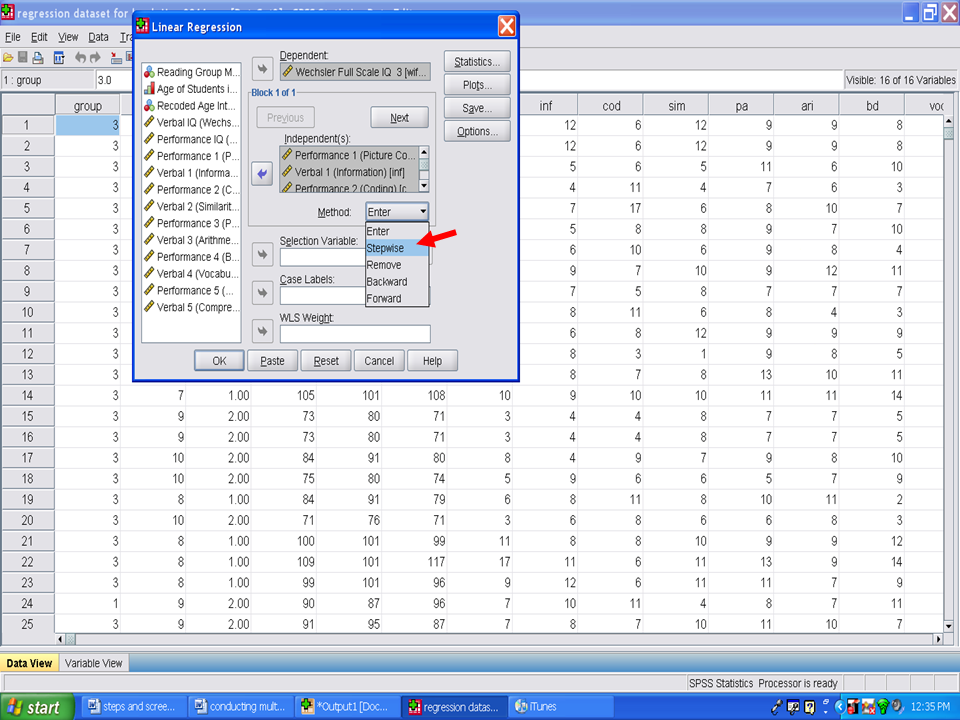
After clicking on Stepwise, your screen will look like the one below.
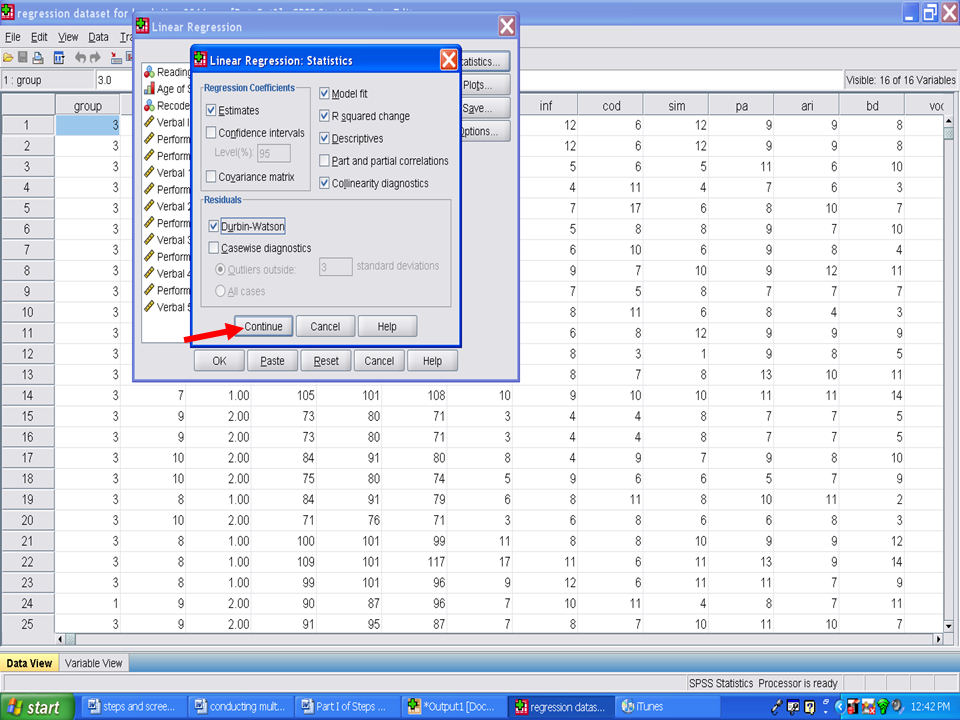
Click on Statistics
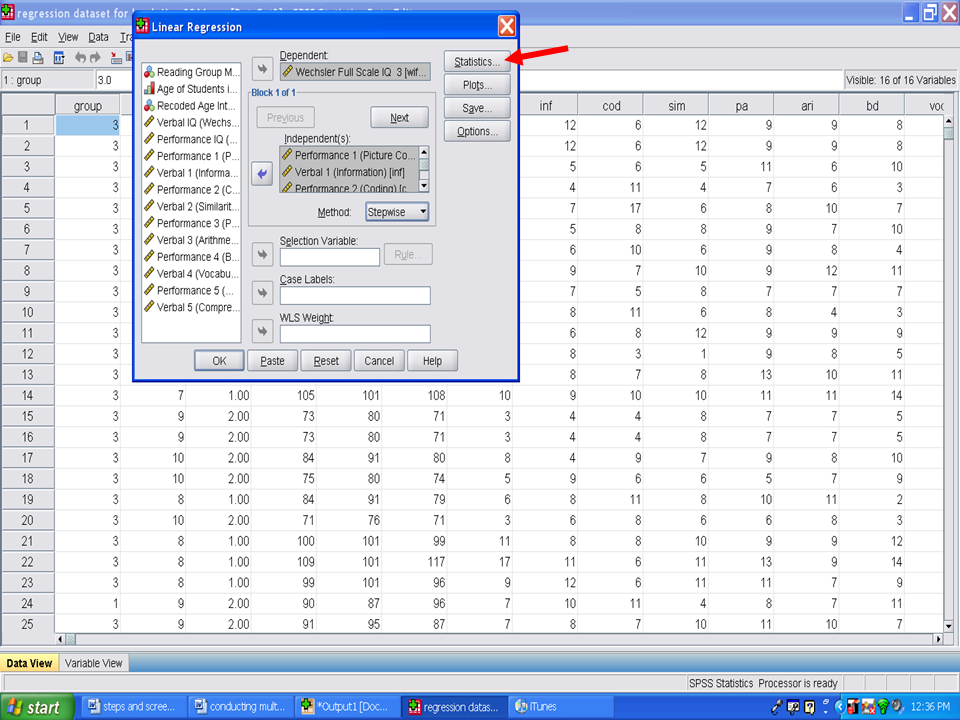
After clicking on Statistics, you will now
√ Click on Estimates (default already checked)
√ Model fit (default already checked)
√ R squared change
√ Descriptives
√ Collinearity Diagnostics
√ Durbin-Watson
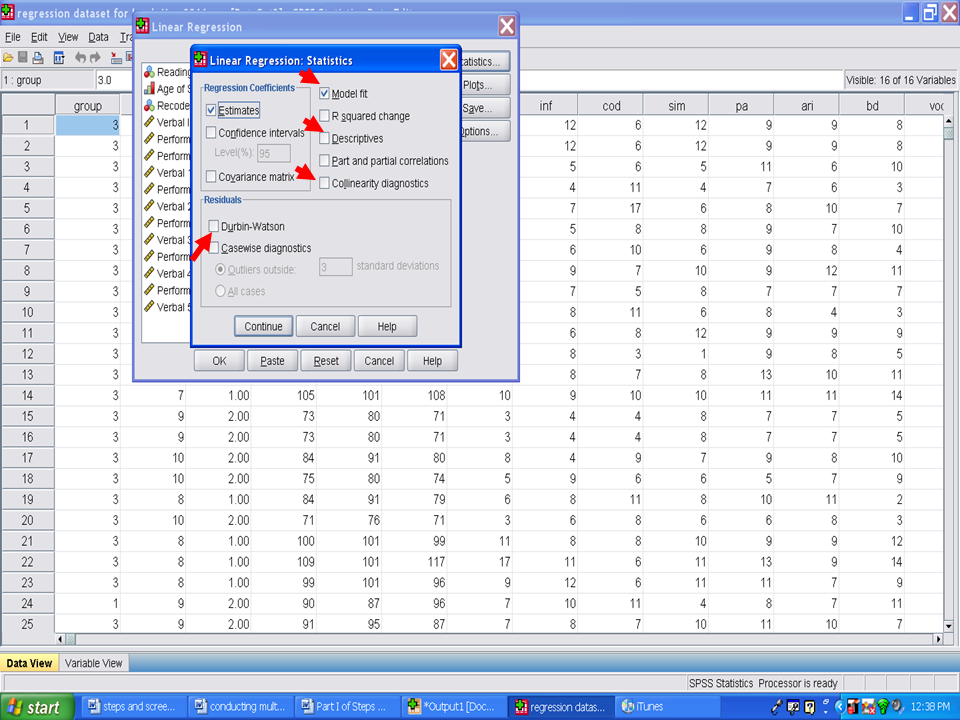
Your screen should like the one below. Now click on Continue.
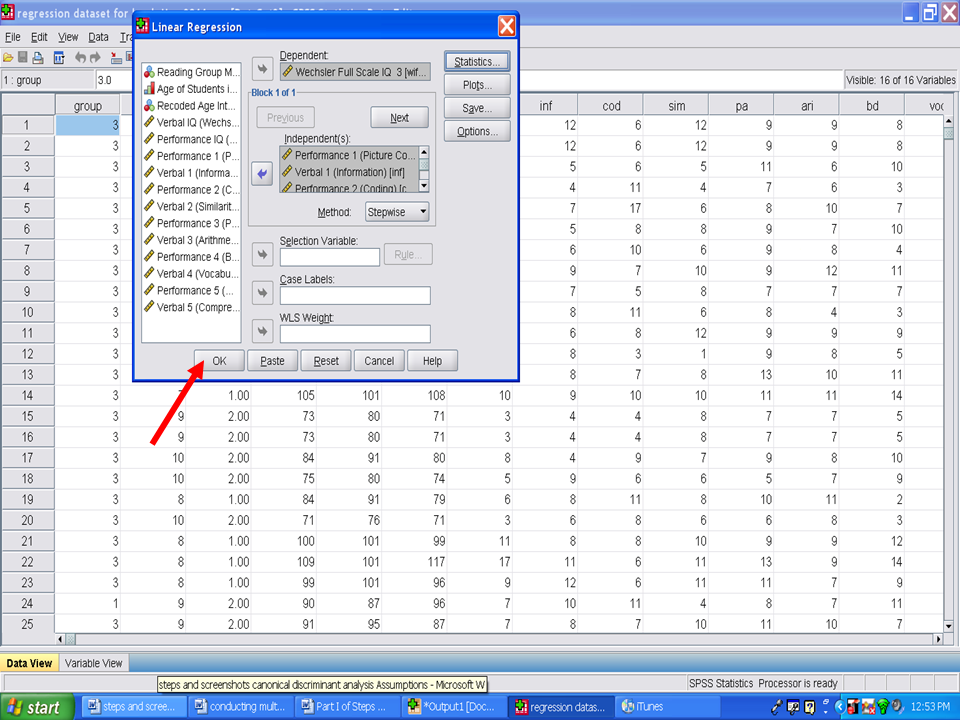
Next click on
√ OK
Go to the Output file if SPSS does not auomatically send you there.
