CHAPTER 4. PROBABILITY TOPICS
Exercise 4.11.9
(Solution on p. 204.)
E and F mutually exclusive events. P (E) = 0.4; P (F) = 0.5. Find P (E | F).
Exercise 4.11.10
J and K are independent events. P(J | K) = 0.3. Find P (J) .
Exercise 4.11.11
(Solution on p. 204.)
U and V are mutually exclusive events. P (U) = 0.26; P (V) = 0.37. Find:
a. P(U AND V) =
b. P(U | V) =
c. P(U OR V) =
Exercise 4.11.12
Q and R are independent events. P (Q) = 0.4 ; P (Q AND R) = 0.1 . Find P (R).
Exercise 4.11.13
(Solution on p. 204.)
Y and Z are independent events.
a. Rewrite the basic Addition Rule P(Y OR Z)
= P (Y) + P (Z) − P (Y AND Z) using the
information that Y and Z are independent events.
b. Use the rewritten rule to find P (Z) if P (Y OR Z) = 0.71 and P (Y) = 0.42 .
Exercise 4.11.14
G and H are mutually exclusive events. P (G) = 0.5; P (H) = 0.3
a. Explain why the following statement MUST be false: P (H | G) = 0.4 .
b. Find: P(H OR G).
c. Are G and H independent or dependent events? Explain in a complete sentence.
Exercise 4.11.15
(Solution on p. 204.)
The following are real data from Santa Clara County, CA. As of March 31, 2000, there was a total
of 3059 documented cases of AIDS in the county. They were grouped into the following categories
(Source: Santa Clara County Public H.D.):
Homosexual/Bisexual
IV Drug User*
Heterosexual Contact
Other
Totals
Female
0
70
136
49
____
Male
2146
463
60
135
____
Totals
____
____
____
____
____
Table 4.5: * includes homosexual/bisexual IV drug users
Suppose one of the persons with AIDS in Santa Clara County is randomly selected. Compute the
following:
a. P(person is female) =
b. P(person has a risk factor Heterosexual Contact) =
c. P(person is female OR has a risk factor of IV Drug User) =
d. P(person is female AND has a risk factor of Homosexual/Bisexual) =
e. P(person is male AND has a risk factor of IV Drug User) =
f. P(female GIVEN person got the disease from heterosexual contact) =
g. Construct a Venn Diagram. Make one group females and the other group heterosexual contact.
189
Exercise 4.11.16
Solve these questions using probability rules. Do NOT use the contingency table above. 3059
cases of AIDS had been reported in Santa Clara County, CA, through March 31, 2000. Those cases
will be our population. Of those cases, 6.4% obtained the disease through heterosexual contact
and 7.4% are female. Out of the females with the disease, 53.3% got the disease from heterosexual
contact.
a. P(person is female) =
b. P(person obtained the disease through heterosexual contact) =
c. P(female GIVEN person got the disease from heterosexual contact) =
d. Construct a Venn Diagram. Make one group females and the other group heterosexual contact.
Fill in all values as probabilities.
Exercise 4.11.17
(Solution on p. 205.)
The following table identifies a group of children by one of four hair colors, and by type of hair.
Hair Type
Brown
Blond
Black
Red
Totals
Wavy
20
15
3
43
Straight
80
15
12
Totals
20
215
Table 4.6
a. Complete the table above.
b. What is the probability that a randomly selected child will have wavy hair?
c. What is the probability that a randomly selected child will have either brown or blond hair?
d. What is the probability that a randomly selected child will have wavy brown hair?
e. What is the probability that a randomly selected child will have red hair, given that he has
straight hair?
f. If B is the event of a child having brown hair, find the probability of the complement of B.
g. In words, what does the complement of B represent?
Exercise 4.11.18
A previous year, the weights of the members of the San Francisco 49ers and the Dallas Cowboys
were published in the San Jose Mercury News. The factual data are compiled into the following
table.
Shirt#
≤ 210
211-250
251-290
290≤
1-33
21
5
0
0
34-66
6
18
7
4
66-99
6
12
22
5
Table 4.7
For the following, suppose that you randomly select one player from the 49ers or Cowboys.
a. Find the probability that his shirt number is from 1 to 33.
b. Find the probability that he weighs at most 210 pounds.
190
CHAPTER 4. PROBABILITY TOPICS
c. Find the probability that his shirt number is from 1 to 33 AND he weighs at most 210 pounds.
d. Find the probability that his shirt number is from 1 to 33 OR he weighs at most 210 pounds.
e. Find the probability that his shirt number is from 1 to 33 GIVEN that he weighs at most 210
pounds.
f. If having a shirt number from 1 to 33 and weighing at most 210 pounds were independent
events, then what should be true about P(Shirt# 1-33 | ≤ 210 pounds)?
Exercise 4.11.19
(Solution on p. 205.)
Approximately 249,000,000 people live in the United States. Of these people, 31,800,000 speak
a language other than English at home. Of those who speak another language at home, over 50
percent speak Spanish. (Source: U.S. Bureau of the Census, 1990 Census)
Let: E = speak English at home; E’ = speak another language at home; S = speak Spanish at home
Finish each probability statement by matching the correct answer.
Probability Statements
Answers
a. P(E’) =
i. 0.8723
b. P(E) =
ii. > 0.50
c. P(S) =
iii. 0.1277
d. P(S|E’) =
iv. > 0.0639
Table 4.8
Exercise 4.11.20
The probability that a male develops some form of cancer in his lifetime is 0.4567 (Source: Ameri-
can Cancer Society). The probability that a male has at least one false positive test result (meaning
the test comes back for cancer when the man does not have it) is 0.51 (Source: USA Today). Some of
the questions below do not have enough information for you to answer them. Write “not enough
information” for those answers.
Let: C = a man develops cancer in his lifetime; P = man has at least one false positive
a. Construct a tree diagram of the situation.
b. P (C) =
c. P(P|C) =
d. P(P|C’ ) =
e. If a test comes up positive, based upon numerical values, can you assume that man has cancer?
Justify numerically and explain why or why not.
Exercise 4.11.21
(Solution on p. 205.)
In 1994, the U.S. government held a lottery to issue 55,000 Green Cards (permits for non-citizens
to work legally in the U.S.). Renate Deutsch, from Germany, was one of approximately 6.5 million
people who entered this lottery. Let G = won Green Card.
a. What was Renate’s chance of winning a Green Card? Write your answer as a probability state-
ment.
b. In the summer of 1994, Renate received a letter stating she was one of 110,000 finalists chosen.
Once the finalists were chosen, assuming that each finalist had an equal chance to win, what
was Renate’s chance of winning a Green Card? Let F = was a finalist. Write your answer as
a conditional probability statement.
191
c. Are G and F independent or dependent events? Justify your answer numerically and also
explain why.
d. Are G and F mutually exclusive events? Justify your answer numerically and also explain why.
NOTE: P.S. Amazingly, on 2/1/95, Renate learned that she would receive her Green Card – true
story!
Exercise 4.11.22
Three professors at George Washington University did an experiment to determine if economists
are more selfish than other people. They dropped 64 stamped, addressed envelopes with $10 cash
in different classrooms on the George Washington campus. 44% were returned overall. From the
economics classes 56% of the envelopes were returned. From the business, psychology, and history
classes 31% were returned. (Source: Wall Street Journal )
Let: R = money returned; E = economics classes; O = other classes
a. Write a probability statement for the overall percent of money returned.
b. Write a probability statement for the percent of money returned out of the economics classes.
c. Write a probability statement for the percent of money returned out of the other classes.
d. Is money being returned independent of the class? Justify your answer numerically and explain
it.
e. Based upon this study, do you think that economists are more selfish than other people? Explain
why or why not. Include numbers to justify your answer.
Exercise 4.11.23
(Solution on p. 205.)
The chart below gives the number of suicides estimated in the U.S. for a recent year by age, race
(black and white), and sex. We are interested in possible relationships between age, race, and sex.
We will let suicide victims be our population. (Source: The National Center for Health Statistics,
U.S. Dept. of Health and Human Services)
Race and Sex
1 - 14
15 - 24
25 - 64
over 64
TOTALS
white, male
210
3360
13,610
22,050
white, female
80
580
3380
4930
black, male
10
460
1060
1670
black, female
0
40
270
330
all others
TOTALS
310
4650
18,780
29,760
Table 4.9
NOTE: Do not include "all others" for parts (f), (g), and (i).
a. Fill in the column for the suicides for individuals over age 64.
b. Fill in the row for all other races.
c. Find the probability that a randomly selected individual was a white male.
d. Find the probability that a randomly selected individual was a black female.
e. Find the probability that a randomly selected individual was black
192
CHAPTER 4. PROBABILITY TOPICS
f. Find the probability that a randomly selected individual was male.
g. Out of the individuals over age 64, find the probability that a randomly selected individual was
a black or white male.
h. Comparing “Race and Sex” to “Age,” which two groups are mutually exclusive? How do you
know?
i. Are being male and committing suicide over age 64 independent events? How do you know?
The next two questions refer to the following: The percent of licensed U.S. drivers (from a recent year)
that are female is 48.60. Of the females, 5.03% are age 19 and under; 81.36% are age 20 - 64; 13.61% are age
65 or over. Of the licensed U.S. male drivers, 5.04% are age 19 and under; 81.43% are age 20 - 64; 13.53% are
age 65 or over. (Source: Federal Highway Administration, U.S. Dept. of Transportation)
Exercise 4.11.24
Complete the following:
a. Construct a table or a tree diagram of the situation.
b. P(driver is female) =
c. P(driver is age 65 or over | driver is female) =
d. P(driver is age 65 or over AND female) =
e. In words, explain the difference between the probabilities in part (c) and part (d).
f. P(driver is age 65 or over) =
g. Are being age 65 or over and being female mutually exclusive events? How do you know
Exercise 4.11.25
(Solution on p. 205.)
Suppose that 10,000 U.S. licensed drivers are randomly selected.
a. How many would you expect to be male?
b. Using the table or tree diagram from the previous exercise, construct a contingency table of
gender versus age group.
c. Using the contingency table, find the probability that out of the age 20 - 64 group, a randomly
selected driver is female.
Exercise 4.11.26
Approximately 86.5% of Americans commute to work by car, truck or van. Out of that group,
84.6% drive alone and 15.4% drive in a carpool. Approximately 3.9% walk to work and approxi-
mately 5.3% take public transportation. (Source: Bureau of the Census, U.S. Dept. of Commerce.
Disregard rounding approximations.)
a. Construct a table or a tree diagram of the situation. Include a branch for all other modes of
transportation to work.
b. Assuming that the walkers walk alone, what percent of all commuters travel alone to work?
c. Suppose that 1000 workers are randomly selected. How many would you expect to travel alone
to work?
d. Suppose that 1000 workers are randomly selected. How many would you expect to drive in a
carpool?
Exercise 4.11.27
Explain what is wrong with the following statements. Use complete sentences.
a. If there’s a 60% chance of rain on Saturday and a 70% chance of rain on Sunday, then there’s a
130% chance of rain over the weekend.
b. The probability that a baseball player hits a home run is greater than the probability that he
gets a successful hit.
193
4.11.1 Try these multiple choice questions.
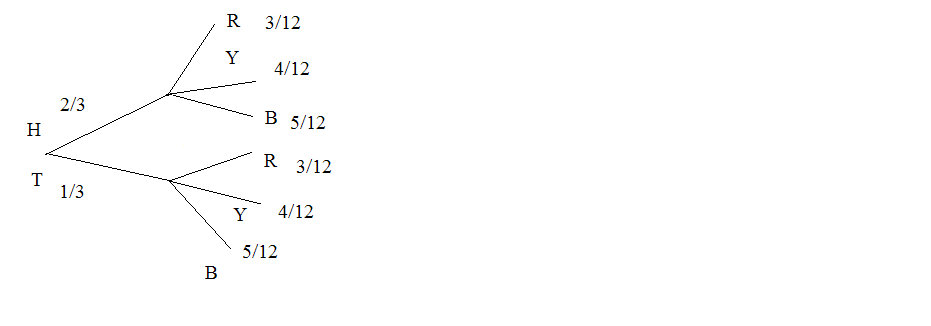
The next two questions refer to the following probability tree diagram which shows tossing an unfair
coin FOLLOWED BY drawing one bead from a cup containing 3 red (R), 4 yellow (Y) and 5 blue (B) beads.
For the coin, P (H) = 2 and P (T) = 1 where H = "heads" and T = "tails”.
3
3
Figure 4.3
Exercise 4.11.28
(Solution on p. 206.)
Find P(tossing a Head on the coin AND a Red bead)
A. 23
B. 5
15
C. 6
36
D. 5
36
Exercise 4.11.29
(Solution on p. 206.)
Find P(Blue bead).
A. 15
36
B. 10
36
C. 10
12
D. 6
36
The next three questions refer to the following table of data obtained from www.baseball-almanac.com12
showing hit information for 4 well known baseball players. Suppose that one hit from the table is randomly
selected.
12http://cnx.org/content/m16836/1.18/www.baseball-almanac.com
194
CHAPTER 4. PROBABILITY TOPICS
NAME
Single
Double
Triple
Home Run
TOTAL HITS
Babe Ruth
1517
506
136
714
2873
Jackie Robinson
1054
273
54
137
1518
Ty Cobb
3603
174
295
114
4189
Hank Aaron
2294
624
98
755
3771
TOTAL
8471
1577
583
1720
12351
Table 4.10
Exercise 4.11.30
(Solution on p. 206.)
Find P(hit was made by Babe Ruth).
A. 1518
2873
B. 2873
12351
C.
583
12351
D. 4189
12351
Exercise 4.11.31
(Solution on p. 206.)
Find P(hit was made by Ty Cobb | The hit was a Home Run)
A. 4189
12351
B. 114
1720
C. 1720
4189
D.
114
12351
Exercise 4.11.32
(Solution on p. 206.)
Are the hit being made by Hank Aaron and the hit being a double independent events?
A. Yes, because P(hit by Hank Aaron | hit is a double) = P(hit by Hank Aaron)
B. No, because P(hit by Hank Aaron | hit is a double) = P(hit is a double)
C. No, because P(hit is by Hank Aaron | hit is a double) = P(hit by Hank Aaron)
D. Yes, because P(hit is by Hank Aaron | hit is a double) = P(hit is a double)
Exercise 4.11.33
(Solution on p. 206.)
Given events G and H: P(G) = 0.43 ; P(H) = 0.26 ; P(H and G) = 0.14
A. Find P(H or G)
B. Find the probability of the complement of event (H and G)
C. Find the probability of the complement of event (H or G)
Exercise 4.11.34
(Solution on p. 206.)
Given events J and K: P(J) = 0.18 ; P(K) = 0.37 ; P(J or K) = 0.45
A. Find P(J and K)
B. Find the probability of the complement of event (J and K)
C. Find the probability of the complement of event (J or K)
195
Exercise 4.11.35
(Solution on p. 206.)
United Blood Services is a blood bank that serves more than 500 hospitals in 18 states. Accord-
ing to their website, http://www.unitedbloodservices.org/humanbloodtypes.html, a person with
type O blood and a negative Rh factor (Rh−) can donate blood to any person with any bloodtype.
Their data show that 43% of people have type O blood and 15% of people have Rh− factor; 52%
of people have type O or Rh− factor.
A. Find the probability that a person has both type O blood and the Rh− factor
B. Find the probability that a person does NOT have both type O blood and the Rh− factor.
Exercise 4.11.36
(Solution on p. 206.)
At a college, 72% of courses have final exams and 46% of courses require research papers. Suppose
that 32% of courses have a research paper and a final exam. Let F be the event that a course has a
final exam. Let R be the event that a course requires a research paper.
A. Find the probability that a course has a final exam or a research project.
B. Find the probability that a course has NEITHER of these two requirements.
Exercise 4.11.37
(Solution on p. 206.)
In a box of assorted cookies, 36% contain chocolate and 12% contain nuts. Of those, 8% contain
both chocolate and nuts. Sean is allergic to both chocolate and nuts.
A. Find the probability that a cookie contains chocolate or nuts (he can’t eat it).
B. Find the probability that a cookie does not contain chocolate or nuts (he can eat it).
Exercise 4.11.38
(Solution on p. 206.)
A college finds that 10% of students have taken a distance learning class and that 40% of students
are part time students. Of the part time students, 20% have taken a distance learning class. Let D
= event that a student takes a distance learning class and E = event that a student is a part time
student
A. Find P(D and E)
B. Find P(E | D)
C. Find P(D or E)
D. Using an appropriate test, show whether D and E are independent.
E. Using an appropriate test, show whether D and E are mutually exclusive.
Exercise 4.11.39
(Solution on p. 206.)
At a certain store the manager has determined that 30% of customers pay cash and 70% of cus-
tomers pay by debit card. (No other method of payment is accepted.) Let M = event that a cus-
tomer pays cash and D= event that a customer pays by debit card.
A. Suppose two customers (Al and Betty) come to the store. Explain why it would be reasonable
to assume that their choices of payment methods are independent of each other.
B. Draw the tree that represents the all possibilities for the 2 customers and their methods of
payment. Write the probabilities along each branch of the tree.
C. For each complete path