Fuzzy Logic Based Interactive Multiple Model Fault Diagnosis for PEM Fuel Cell Systems
439
⎡ 6
− . 30908 0
− 10 9544
.
0
8
3 . 74458 0
0
24
05866
.
⎤
⎢0 − 161 . 083 0
0
51
. 52923 0
− 18 0261
.
0
⎥
⎢
⎥
⎢ 18
− . 7858
0
− 46 3136
.
0
275
6592
.
0
0
158
. 3741⎥
⎢
⎥
⎢0 0
0
− 17 3506
.
193
. 9373 0
0
0
=
⎥
c
A
⎢
1 299576
.
0
2
. 969317 0
. 3977 − 38 7024
.
0
. 105748 0
0
⎥
⎢
⎥
⎢16 64244
.
0
3
8 . 02522 5
. 066579 − 479 . 384 0
0
0
⎥
⎢0 − 450 . 386 0 0
142
. 2084 0
80 . 9472 0
⎥
−
⎢
⎥
⎢2 . 02257 0
4 621237
.
0
0
0
0
−
⎣
51 2108
.
⎥⎦
⎡0 0
0
5
.066579 − 116.446 0
0
0
⎤
C = ⎢0 0
0
0
1
0
0
⎥
c
0
⎢
⎥
⎢12.96989 10.32532
−
⎣
0.56926 0
0
0
0
0
⎥⎦
⎡ 0
0
⎤
⎡ 0
0
0
3
.94668 0
0
0
0 T
⎤
=
⎢
⎥
=
uc
B
⎢
, D
0
0
0 . 03159 0 . 00398 0
0
0
0
0.05242 0
⎥
−
−
−
⎣
⎦
uc
⎢
⎥
⎢ 0
−
⎣
0.29656⎥⎦
Table 2. Parameters for the linear fuel cell model in (40)-(41)
=
=
1
A
u
B 1
⎡0.1779 0
− 0.0333 0.0047
− 0.1284 0.0245
0
− 0.02 ⎤
⎡0.0451 − 0 0145
.
⎤
⎢0.0012 0 0
.0004 0.0002
− 0.0169 0.0019
0
0
.002 ⎥
⎢
⎥
⎢
⎥
0.004 0
⎢
⎥
⎢ 0.0401
−
0
0
.0263 0.0038
− 0.3963 0.0415
0 0
.0663 ⎥
⎢0.0878 0.0034
⎥
⎢
⎥
⎢
⎥
⎢0.0444 0
0
.0177 0.0079
− 0.5741 0.0676
0
0
.0806 ⎥
0.3634 −
⎢
0.0028 ⎥
⎢0.0036 0
0
.0012 0
0006
.
− 0.0517 0
. 0057 0
0
.0059⎥
⎢
⎥
−
⎢
⎥
0.0123 0.0003
⎢
⎥
⎢0.0408 0
0
.01 0
.0053 − 3.9786 0.3265
0
0
.0543 ⎥
⎢0.1474 − 0.0032⎥
⎢ 0.0004 0 0.0003 0.0001 0.0031
0.0005 0
0.0011 ⎥
−
−
−
−
−
⎢
⎥
⎢
⎥
0.0007
−
0.0013
⎢
⎥
⎢0.0035 0
0
.0011 0.0006
−
⎣
0.0408 0.00
48 0
0
.0055 ⎥⎦
⎢ 0.0097
−
⎣
0.0003 ⎥⎦
C =
=
1
u
D 1
⎡0 0
0
5
.0666 − 116.446 0
0
0
⎤
⎡ 0
0
⎤
⎢
0 0
0
0
1
0
0
0
⎥
⎢
⎥
⎢
⎥
0
0
⎢
⎥
⎢12.9699 10.3253
− 0.5693 0
0
0
0
0
⎥
⎣
⎦
⎢ 0
−
⎣
0.2966⎥⎦
Table 3. Parameters for the discretized model
Actuator (or control surface) failures were modeled by multiplying the respective column of
u
B 1 and 1,
u
D
by a factor between zero and one, where zero corresponds to a total (or
complete) actuator failure or missing control surface and one to an unimpaired (normal)
actuator/control surface. Likewise for sensor failures, where the role of u
B 1 and u
D 1 is
440
Discrete Time Systems
replaced with C 1 . It was assumed that the damage does not affect the fuel cell system
dynamic matrix 1
A , implying that the dynamics of the system are not changed.
Let sampling period T = 1 s. Discretization of (40)-(41) yields the matrices for normal mode
T
τ
T
τ
c
A T
=
c
A
=
τ
c
A
=
τ
=
=
=
1
A
e
, u
B 1 ( e d ) B
∫
, Bω
( e d ) B
∫
, C
C , D , D , Dυ , D , which
0
c
1
0
ω c
1
c
u 1
u 1
1
υ1
are specified in Table 3.
The fault modes in this work are more general and complex than those considered before,
including total single sensor or actuator failures, partial single sensor or actuator failures,
total and partial single sensor and/or actuator failures, and simultaneous sensor and
actuator failures.
5. Results and discussion
Scenario 1: Single total/partial actuator faulty mode
First, in order to compare the performance between the conventional IMM and the proposed
fuzzy logic based IMM approach, consider the simplest situation in which only a single total
(or partial) sensor or actuator is running failure. Specifically, only partial failure for the
actuator according to the second control input, i.e. stack current, Ist, is considered. The
failure occurs after the 50th sampling period with failure amplitude of 50%. Two models
consisting the normal mode and second actuator failure with amplitude of 50% are used for
the IMM filter. The fault decision criterion in (29) is used with the threshold '
μ = 2.5
T
. The
transition matrix for the conventional IMM and the initial for the proposed approach are set
as follows
⎡0.99 0.01
⎤
Π = ⎢
0.1
0
.9 ⎥
⎣
⎦
The results of the FDD based on our proposed approach are compared with that of the
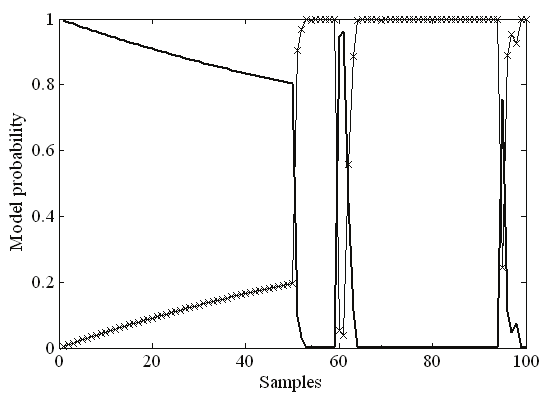
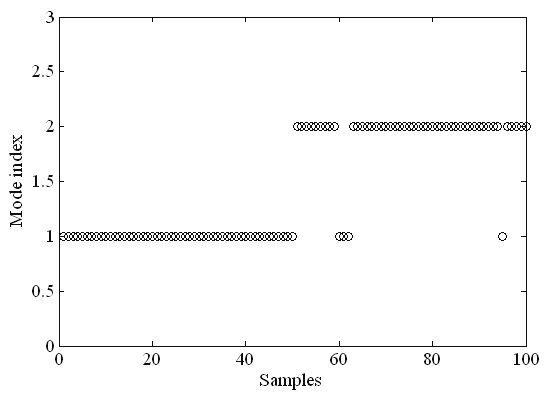
conventional IMM filter. Fig. 6 (a) and (b) represent the model probabilities of the 2 models
and the mode index according to (29) for the conventional IMM, respectively. From Fig. 6, it
is obvious that the model probability related to the failure model does not keep a dominant
value for the conventional IMM approach. On that account, momentary false failure mode is
declared after the failure although the approach works well before the first failure occurs,
Fig. 6. The model probabilities and the mode index for the conventional IMM approach
Fuzzy Logic Based Interactive Multiple Model Fault Diagnosis for PEM Fuel Cell Systems
441
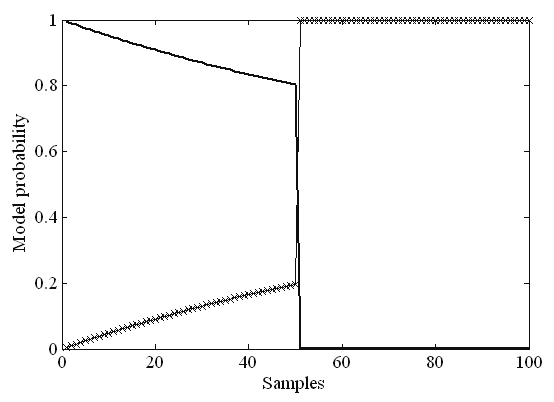
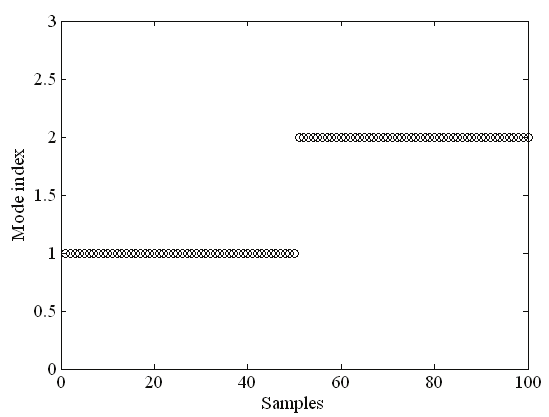
just as shown in Fig. 6 (b). The performance of the proposed fuzzy logic based IMM
approach is stable to hold a higher model probability than that of the conventional filter (cf.
Fig. 7 (a)-(b)). This concludes that the improved IMM approach has better performance and,
more importantly, reliability that the conventional IMM filter.
Fig. 7. The model probabilities and the mode index for the proposed fuzzy logic based IMM
approach
Scenario 2: Single total/partial sensor/actuator faulty mode sequence
Consider the situation in which only a single total (or partial) sensor or actuator failure is
possible. Then there are a total of 4 possible model (one normal plus 3 failure models) for
sensor failure and 3 possible models (one normal plus 2 failure models) for actuator failures.
Similarly, there are 4 partial sensor failure models and 3 partial actuator failures models.
Due to the space limitation, only the simulation results for the sensor failure case are
presented herein. Let the pairs ( z 1, un), ( z 2, us 1), ( z 3, us 2), ( z 4, us 3) designate the measurements and corresponding causes associated with the normal/fault-free mode, and sensor fault for
the first to the third sensor, respectively. Furthermore, let the pair ( z 5, us 3 p) denote the
measurement and corresponding causes associated with the partial fault for the third sensor.
Consider the sequence of events designated by z=[ z 1, z 2, z 1, z 3, z 1, z 4, z 1, z 5, z 1] and u=[ un, us 1, un, us 2, un, us 3, un, us 3 p, un], where the first, second, third total sensor failures, and the partial third sensor failure occur at the beginning of the time horizon windows [31, 50], [81, 110],
[141, 180], and [211, 250], respectively. Note that z 1 corresponds to the normal mode. The
faults persist for the duration of 20, 30, 40, and 40 samples, respectively.
Let the initial model probability for both the conventional IMM and the fuzzy logic based
IMM approach μ(0) = [0.2, 0.2, 0.2, 0.2, 0.2] T. The transition matrix for the conventional
IMM and the initial one for the proposed approach are set as
⎡0.96 0.01
0.01
0.01
0.01
⎤
⎢ 0 .1 0 .9 0
0
0
⎥
⎢
⎥
Π = ⎢ 0.1
0
0.9
0
0
⎥
⎢
⎥
⎢ 0
.1 0
0
0
.9 0
⎥
⎢ 0 .1 0 0 0 0 .9 ⎥
⎣
⎦
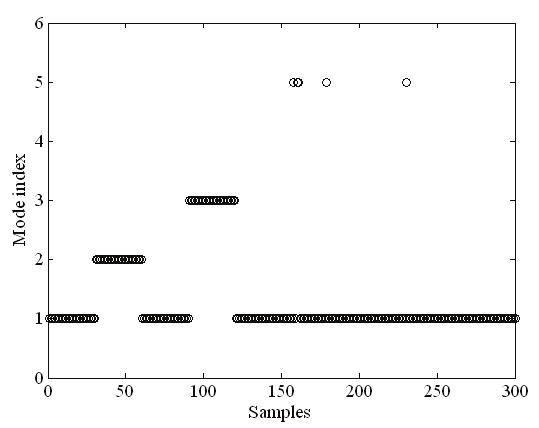
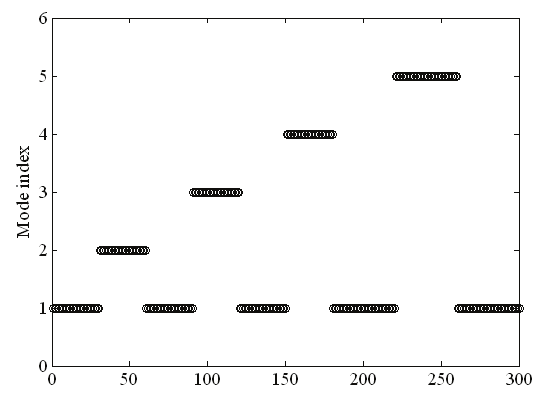
The mode indexes as a function of sampling period for the conventional IMM and the fuzzy
logic based IMM approach are compared in Fig. 8.
442
Discrete Time Systems
Fig. 8. The mode index in the 2nd scenario for (a) the conventional IMM; and (b) the fuzzy
logic based IMM


