Find the third quartile of ages of cars in the lot. This means you will have to find the value such
that 3 , or 75%, of the cars are at most (less than or equal to) that age.
4
a. Sketch the graph. Shade the area of interest.
Figure 5.11
b. Find the value k such that P (x < k) = 0.75.
c. The third quartile is:
Available for free at Connexions <http://cnx.org/content/col10522/1.40>

243
5.7 Practice 2: Exponential Distribution7
5.7.1 Student Learning Outcomes
• The student will analyze data following the exponential distribution.
5.7.2 Given
Carbon-14 is a radioactive element with a half-life of about 5730 years. Carbon-14 is said to decay exponen-
tially. The decay rate is 0.000121 . We start with 1 gram of carbon-14. We are interested in the time (years)
it takes to decay carbon-14.
5.7.3 Describe the Data
Exercise 5.7.1
What is being measured here?
Exercise 5.7.2
(Solution on p. 258.)
Are the data discrete or continuous?
Exercise 5.7.3
(Solution on p. 258.)
In words, define the Random Variable X.
Exercise 5.7.4
(Solution on p. 258.)
What is the decay rate (m)?
Exercise 5.7.5
(Solution on p. 258.)
The distribution for X is:
5.7.4 Probability
Exercise 5.7.6
(Solution on p. 258.)
Find the amount (percent of 1 gram) of carbon-14 lasting less than 5730 years. This means, find
P (x < 5730).
a. Sketch the graph. Shade the area of interest.
Figure 5.12
7This content is available online at <http://cnx.org/content/m16811/1.11/>.
Available for free at Connexions <http://cnx.org/content/col10522/1.40>

244
CHAPTER 5. CONTINUOUS RANDOM VARIABLES
b. Find the probability. P (x < 5730) =
Exercise 5.7.7
(Solution on p. 258.)
Find the percentage of carbon-14 lasting longer than 10,000 years.
a. Sketch the graph. Shade the area of interest.
Figure 5.13
b. Find the probability. P (x > 10000) =
Exercise 5.7.8
(Solution on p. 258.)
Thirty percent (30%) of carbon-14 will decay within how many years?
a. Sketch the graph. Shade the area of interest.
Figure 5.14
b. Find the value k such that P (x < k) = 0.30.
Available for free at Connexions <http://cnx.org/content/col10522/1.40>
245
5.8 Homework8
For each probability and percentile problem, DRAW THE PICTURE!
Exercise 5.8.1
Consider the following experiment. You are one of 100 people enlisted to take part in a study to
determine the percent of nurses in America with an R.N. (registered nurse) degree. You ask nurses
if they have an R.N. degree. The nurses answer “yes” or “no.” You then calculate the percentage
of nurses with an R.N. degree. You give that percentage to your supervisor.
a. What part of the experiment will yield discrete data?
b. What part of the experiment will yield continuous data?
Exercise 5.8.2
When age is rounded to the nearest year, do the data stay continuous, or do they become discrete?
Why?
Exercise 5.8.3
(Solution on p. 258.)
Births are approximately uniformly distributed between the 52 weeks of the year. They can be
said to follow a Uniform Distribution from 1 – 53 (spread of 52 weeks).
a. X ∼
b. Graph the probability distribution.
c. f (x) =
d. µ =
e. σ =
f. Find the probability that a person is born at the exact moment week 19 starts. That is, find
P (x = 19) =
g. P (2 < x < 31) =
h. Find the probability that a person is born after week 40.
i. P (12 < x | x < 28) =
j. Find the 70th percentile.
k. Find the minimum for the upper quarter.
Exercise 5.8.4
A random number generator picks a number from 1 to 9 in a uniform manner.
a. X~
b. Graph the probability distribution.
c. f (x) =
d. µ =
e. σ =
f. P (3.5 < x < 7.25) =
g. P (x > 5.67) =
h. P (x > 5 | x > 3) =
i. Find the 90th percentile.
Exercise 5.8.5
(Solution on p. 258.)
The time (in minutes) until the next bus departs a major bus depot follows a distribution with
f (x) = 1 where x goes from 25 to 45 minutes.
20
a. Define the random variable. X =
8This content is available online at <http://cnx.org/content/m16807/1.14/>.
Available for free at Connexions <http://cnx.org/content/col10522/1.40>
246
CHAPTER 5. CONTINUOUS RANDOM VARIABLES
b. X~
c. Graph the probability distribution.
d. The distribution is ______________ (name of distribution). It is _____________ (discrete or con-
tinuous).
e. µ =
f. σ =
g. Find the probability that the time is at most 30 minutes. Sketch and label a graph of the distri-
bution. Shade the area of interest. Write the answer in a probability statement.
h. Find the probability that the time is between 30 and 40 minutes. Sketch and label a graph of
the distribution. Shade the area of interest. Write the answer in a probability statement.
i. P (25 < x < 55) = _________. State this in a probability statement (similar to g and h ), draw
the picture, and find the probability.
j. Find the 90th percentile. This means that 90% of the time, the time is less than _____ minutes.
k. Find the 75th percentile. In a complete sentence, state what this means. (See j.)
l. Find the probability that the time is more than 40 minutes given (or knowing that) it is at least
30 minutes.
Exercise 5.8.6
According to a study by Dr. John McDougall of his live-in weight loss program at St. Helena
Hospital, the people who follow his program lose between 6 and 15 pounds a month until they
approach trim body weight. Let’s suppose that the weight loss is uniformly distributed. We are
interested in the weight loss of a randomly selected individual following the program for one
month. (Source: The McDougall Program for Maximum Weight Loss by John A. McDougall,
M.D.)
a. Define the random variable. X =
b. X~
c. Graph the probability distribution.
d. f (x) =
e. µ =
f. σ =
g. Find the probability that the individual lost more than 10 pounds in a month.
h. Suppose it is known that the individual lost more than 10 pounds in a month. Find the proba-
bility that he lost less than 12 pounds in the month.
i. P (7 < x < 13 | x > 9) = __________. State this in a probability question (similar to g and h),
draw the picture, and find the probability.
Exercise 5.8.7
(Solution on p. 258.)
A subway train on the Red Line arrives every 8 minutes during rush hour. We are interested in the
length of time a commuter must wait for a train to arrive. The time follows a uniform distribution.
a. Define the random variable. X =
b. X~
c. Graph the probability distribution.
d. f (x) =
e. µ =
f. σ =
g. Find the probability that the commuter waits less than one minute.
h. Find the probability that the commuter waits between three and four minutes.
i. 60% of commuters wait more than how long for the train? State this in a probability question
(similar to g and h), draw the picture, and find the probability.
Available for free at Connexions <http://cnx.org/content/col10522/1.40>
247
Exercise 5.8.8
The age of a first grader on September 1 at Garden Elementary School is uniformly distributed
from 5.8 to 6.8 years. We randomly select one first grader from the class.
a. Define the random variable. X =
b. X~
c. Graph the probability distribution.
d. f (x) =
e. µ =
f. σ =
g. Find the probability that she is over 6.5 years.
h. Find the probability that she is between 4 and 6 years.
i. Find the 70th percentile for the age of first graders on September 1 at Garden Elementary School.
Exercise 5.8.9
(Solution on p. 259.)
Let X~Exp(0.1)
a. decay rate=
b. µ =
c. Graph the probability distribution function.
d. On the above graph, shade the area corresponding to P (x < 6) and find the probability.
e. Sketch a new graph, shade the area corresponding to P (3 < x < 6) and find the probability.
f. Sketch a new graph, shade the area corresponding to P (x > 7) and find the probability.
g. Sketch a new graph, shade the area corresponding to the 40th percentile and find the value.
h. Find the average value of x.
Exercise 5.8.10
Suppose that the length of long distance phone calls, measured in minutes, is known to have an
exponential distribution with the average length of a call equal to 8 minutes.
a. Define the random variable. X =
b. Is X continuous or discrete?
c. X~
d. µ =
e. σ =
f. Draw a graph of the probability distribution. Label the axes.
g. Find the probability that a phone call lasts less than 9 minutes.
h. Find the probability that a phone call lasts more than 9 minutes.
i. Find the probability that a phone call lasts between 7 and 9 minutes.
j. If 25 phone calls are made one after another, on average, what would you expect the total to be?
Why?
Exercise 5.8.11
(Solution on p. 259.)
Suppose that the useful life of a particular car battery, measured in months, decays with parameter
0.025. We are interested in the life of the battery.
a. Define the random variable. X =
b. Is X continuous or discrete?
c. X~
d. On average, how long would you expect 1 car battery to last?
e. On average, how long would you expect 9 car batteries to last, if they are used one after another?
f. Find the probability that a car battery lasts more than 36 months.
Available for free at Connexions <http://cnx.org/content/col10522/1.40>
248
CHAPTER 5. CONTINUOUS RANDOM VARIABLES
g. 70% of the batteries last at least how long?
Exercise 5.8.12
The percent of persons (ages 5 and older) in each state who speak a language at home other than
English is approximately exponentially distributed with a mean of 9.848 . Suppose we randomly
pick a state. (Source: Bureau of the Census, U.S. Dept. of Commerce)
a. Define the random variable. X =
b. Is X continuous or discrete?
c. X~
d. µ =
e. σ =
f. Draw a graph of the probability distribution. Label the axes.
g. Find the probability that the percent is less than 12.
h. Find the probability that the percent is between 8 and 14.
i. The percent of all individuals living in the United States who speak a language at home other
than English is 13.8 .
i. Why is this number different from 9.848%?
ii. What would make this number higher than 9.848%?
Exercise 5.8.13
(Solution on p. 259.)
The time (in years) after reaching age 60 that it takes an individual to retire is approximately
exponentially distributed with a mean of about 5 years. Suppose we randomly pick one retired
individual. We are interested in the time after age 60 to retirement.
a. Define the random variable. X =
b. Is X continuous or discrete?
c. X~
d. µ =
e. σ =
f. Draw a graph of the probability distribution. Label the axes.
g. Find the probability that the person retired after age 70.
h. Do more people retire before age 65 or after age 65?
i. In a room of 1000 people over age 80, how many do you expect will NOT have retired yet?
Exercise 5.8.14
The cost of all maintenance for a car during its first year is approximately exponentially dis-
tributed with a mean of $150.
a. Define the random variable. X =
b. X~
c. µ =
d. σ =
e. Draw a graph of the probability distribution. Label the axes.
f. Find the probability that a car required over $300 for maintenance during its first year.
Available for free at Connexions <http://cnx.org/content/col10522/1.40>
249
5.8.1 Try these multiple choice problems
The next three questions refer to the following information. The average lifetime of a certain new cell
phone is 3 years. The manufacturer will replace any cell phone failing within 2 years of the date of purchase.
The lifetime of these cell phones is known to follow an exponential distribution.
Exercise 5.8.15
(Solution on p. 259.)
The decay rate is
A. 0.3333
B. 0.5000
C. 2.0000
D. 3.0000
Exercise 5.8.16
(Solution on p. 259.)
What is the probability that a phone will fail within 2 years of the date of purchase?
A. 0.8647
B. 0.4866
C. 0.2212
d. 0.9997
Exercise 5.8.17
(Solution on p. 259.)
What is the median lifetime of these phones (in years)?
A. 0.1941
B. 1.3863
C. 2.0794
D. 5.5452
The next three questions refer to the following information. The Sky Train from the terminal to the rental
car and long term parking center is supposed to arrive every 8 minutes. The waiting times for the train are
known to follow a uniform distribution.
Exercise 5.8.18
(Solution on p. 259.)
What is the average waiting time (in minutes)?
A. 0.0000
B. 2.0000
C. 3.0000
D. 4.0000
Exercise 5.8.19
(Solution on p. 259.)
Find the 30th percentile for the waiting times (in minutes).
A. 2.0000
B. 2.4000
C. 2.750
D. 3.000
Exercise 5.8.20
(Solution on p. 259.)
The probability of waiting more than 7 minutes given a person has waited more than 4 minutes
is?
A. 0.1250
Available for free at Connexions <http://cnx.org/content/col10522/1.40>
250
CHAPTER 5. CONTINUOUS RANDOM VARIABLES
B. 0.2500
C. 0.5000
D. 0.7500
Available for free at Connexions <http://cnx.org/content/col10522/1.40>
251
5.9 Review9
Exercise 5.9.1 – Exercise 5.9.7 refer to the following study: A recent study of mothers of junior high school
children in Santa Clara County reported that 76% of the mothers are employed in paid positions. Of those
mothers who are employed, 64% work full-time (over 35 hours per week), and 36% work part-time. How-
ever, out of all of the mothers in the population, 49% work full-time. The population under study is made
up of mothers of junior high school children in Santa Clara County.
Let E =employed, Let F =full-time employment
Exercise 5.9.1
(Solution on p. 259.)
a. Find the percent of all mothers in the population that NOT employed.
b. Find the percent of mothers in the population that are employed part-time.
Exercise 5.9.2
(Solution on p. 259.)
The type of employment is considered to be what type of data?
Exercise 5.9.3
(Solution on p. 259.)
Find the probability that a randomly selected mother works part-time given that she is employed.
Exercise 5.9.4
(Solution on p. 260.)
Find the probability that a randomly selected person from the population will be employed OR
work full-time.
Exercise 5.9.5
(Solution on p. 260.)
Based upon the above information, are being employed AND working part-time:
a. mutually exclusive events? Why or why not?
b. independent events? Why or why not?
Exercise 5.9.6 - Exercise 5.9.7 refer to the following: We randomly pick 10 mothers from the above popu-
lation. We are interested in the number of the mothers that are employed. Let X =number of mothers that
are employed.
Exercise 5.9.6
(Solution on p. 260.)
State the distribution for X.
Exercise 5.9.7
(Solution on p. 260.)
Find the probability that at least 6 are employed.
Exercise 5.9.8
(Solution on p. 260.)
We expect the Statistics Discussion Board to have, on average, 14 questions posted to it per week.
We are interested in the number of questions posted to it per day.
a. Define X.
b. What are the values that the random variable may take on?
c. State the distribution for X.
d. Find the probability that from 10 to 14 (inclusive) questions are posted to the Listserv on a
randomly picked day.
Exercise 5.9.9
(Solution on p. 260.)
A person invests $1000 in stock of a company that hopes to go public in 1 year.
• The probability that the person will lose all his money after 1 year (i.e. his stock will be
worthless) is 35%.
9This content is available online at <http://cnx.org/content/m16810/1.11/>.
Available for free at Connexions <http://cnx.org/content/col10522/1.40>
252
CHAPTER 5. CONTINUOUS RANDOM VARIABLES
• The probability that the person’s stock will still have a value of $1000 after 1 year (i.e. no
profit and no loss) is 60%.
• The probability that the person’s stock will increase in value by $10,000 after 1 year (i.e. will
be worth $11,000) is 5%.
Find the expected PROFIT after 1 year.
Exercise 5.9.10
(Solution on p. 260.)
Rachel’s piano cost $3000. The average cost for a piano is $4000 with a standard deviation of
$2500. Becca’s guitar cost $550. The average cost for a guitar is $500 with a standard deviation
of $200. Matt’s drums cost $600. The average cost for drums is $700 with a standard deviation of
$100. Whose cost was lowest when compared to his or her own instrument? Justify your answer.
Exercise 5.9.11
(Solution on p. 260.)
For each statement below, explain why each is either true or false.
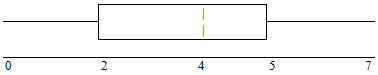
a. 25% of the data are at most 5.
b. There is the same amount of data from 4 – 5 as there is from 5 – 7.
c. There are no data values of 3.
d. 50% of the data are 4.
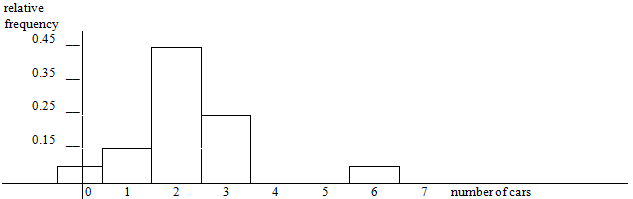
Exercise 5.9.12 – Exercise 5.9.13 refer to the following: 64 faculty members were asked the number of
cars they owned (including spouse and children’s cars). The results are given in the following graph: