D. conclude that the pass rate for Math 1A is the same as the pass rate for Math 1B when, in fact,
they are the same.
Exercise 14.1.13
(Solution on p. 668.)
The correct decision is to:
A. reject Ho
B. not reject Ho
C. There is not enough information given to conduct the hypothesis test
Kia, Alejandra, and Iris are runners on the track teams at three different schools. Their running times, in
minutes, and the statistics for the track teams at their respective schools, for a one mile run, are given in the
table below:
Running Time
School Average Running Time
School Standard Deviation
Kia
4.9
5.2
.15
Alejandra
4.2
4.6
.25
Iris
4.5
4.9
.12
Table 14.3
Exercise 14.1.14
(Solution on p. 668.)
Which student is the BEST when compared to the other runners at her school?
A. Kia
B. Alejandra
C. Iris
D. Impossible to determine
Questions 15 – 16 refer to the following:
The following adult ski sweater prices are from the Gorsuch Ltd. Winter catalog:
{$212, $292, $278, $199$280, $236}
Assume the underlying sweater price population is approximately normal. The null hypothesis is that the
mean price of adult ski sweaters from Gorsuch Ltd. is at least $275.
Exercise 14.1.15
(Solution on p. 668.)
The correct distribution to use for the hypothesis test is:
A. Normal
B. Binomial
C. Student’s-t
D. Exponential
Available for free at Connexions <http://cnx.org/content/col10522/1.40>
APPENDIX
617
Exercise 14.1.16
(Solution on p. 668.)
The hypothesis test:
A. is two-tailed
B. is left-tailed
C. is right-tailed
D. has no tails
Exercise 14.1.17
(Solution on p. 668.)
Sara, a statistics student, wanted to determine the mean number of books that college professors
have in their office. She randomly selected 2 buildings on campus and asked each professor in the
selected buildings how many books are in his/her office. Sara surveyed 25 professors. The type
of sampling selected is a:
A. simple random sampling
B. systematic sampling
C. cluster sampling
D. stratified sampling
Exercise 14.1.18
(Solution on p. 668.)
A clothing store would use which measure of the center of data when placing orders for the
typical "middle" customer?
A. Mean
B. Median
C. Mode
D. IQR
Exercise 14.1.19
(Solution on p. 668.)
In a hypothesis test, the p-value is
A. the probability that an outcome of the data will happen purely by chance when the null hy-
pothesis is true.
B. called the preconceived alpha.
C. compared to beta to decide whether to reject or not reject the null hypothesis.
D. Answer choices A and B are both true.
Questions 20 - 22 refer to the following:
A community college offers classes 6 days a week: Monday through Saturday. Maria conducted a study of
the students in her classes to determine how many days per week the students who are in her classes come
to campus for classes. In each of her 5 classes she randomly selected 10 students and asked them how many
days they come to campus for classes. Each of her classes are the same size. The results of her survey are
summarized in the table below.
Number of Days on Campus
Frequency
Relative Frequency
Cumulative Relative Frequency
1
2
2
12
.24
3
10
.20
4
.98
5
0
6
1
.02
1.00
Available for free at Connexions <http://cnx.org/content/col10522/1.40>
618
APPENDIX
Table 14.4
Exercise 14.1.20
(Solution on p. 668.)
Combined with convenience sampling, what other sampling technique did Maria use?
A. simple random
B. systematic
C. cluster
D. stratified
Exercise 14.1.21
(Solution on p. 668.)
How many students come to campus for classes 4 days a week?
A. 49
B. 25
C. 30
D. 13
Exercise 14.1.22
(Solution on p. 668.)
What is the 60th percentile for the this data?
A. 2
B. 3
C. 4
D. 5
The next two questions refer to the following:
The following data are the results of a random survey of 110 Reservists called to active duty to increase
security at California airports.
Number of Dependents
Frequency
0
11
1
27
2
33
3
20
4
19
Table 14.5
Exercise 14.1.23
(Solution on p. 668.)
Construct a 95% Confidence Interval for the true population mean number of dependents of
Reservists called to active duty to increase security at California airports.
A. (1.85, 2.32)
B. (1.80, 2.36)
C. (1.97, 2.46)
D. (1.92, 2.50)
Exercise 14.1.24
(Solution on p. 668.)
The 95% confidence Interval above means:
Available for free at Connexions <http://cnx.org/content/col10522/1.40>
APPENDIX
619
A. 5% of Confidence Intervals constructed this way will not contain the true population aveage
number of dependents.
B. We are 95% confident the true population mean number of dependents falls in the interval.
C. Both of the above answer choices are correct.
D. None of the above.
Exercise 14.1.25
(Solution on p. 669.)
X ∼U (4, 10). Find the 30th percentile.
A. 0.3000
B. 3
C. 5.8
D. 6.1
Exercise 14.1.26
(Solution on p. 669.)
If X ∼Exp (0.8), then P (x < µ) =
A. 0.3679
B. 0.4727
C. 0.6321
D. cannot be determined
Exercise 14.1.27
(Solution on p. 669.)
The lifetime of a computer circuit board is normally distributed with a mean of 2500 hours and a
standard deviation of 60 hours. What is the probability that a randomly chosen board will last at
most 2560 hours?
A. 0.8413
B. 0.1587
C. 0.3461
D. 0.6539
Exercise 14.1.28
(Solution on p. 669.)
A survey of 123 Reservists called to active duty as a result of the September 11, 2001, attacks
was conducted to determine the proportion that were married. Eighty-six reported being married.
Construct a 98% confidence interval for the true population proportion of reservists called to active
duty that are married.
A. (0.6030, 0.7954)
B. (0.6181, 0.7802)
C. (0.5927, 0.8057)
D. (0.6312, 0.7672)
Exercise 14.1.29
(Solution on p. 669.)
Winning times in 26 mile marathons run by world class runners average 145 minutes with a stan-
dard deviation of 14 minutes. A sample of the last 10 marathon winning times is collected.
Let x = mean winning times for 10 marathons.
The distribution for x is:
A. N 145, 14
√10
B. N (145, 14)
Available for free at Connexions <http://cnx.org/content/col10522/1.40>
620
APPENDIX
C. t9
D. t10
Exercise 14.1.30
(Solution on p. 669.)
Suppose that Phi Beta Kappa honors the top 1% of college and university seniors. Assume that
grade point means (G.P.A.) at a certain college are normally distributed with a 2.5 mean and a
standard deviation of 0.5. What would be the minimum G.P.A. needed to become a member of
Phi Beta Kappa at that college?
A. 3.99
B. 1.34
C. 3.00
D. 3.66
The number of people living on American farms has declined steadily during this century. Here are data
on the farm population (in millions of persons) from 1935 to 1980.
Year
1935
1940
1945
1950
1955
1960
1965
1970
1975
1980
Population
32.1
30.5
24.4
23.0
19.1
15.6
12.4
9.7
8.9
7.2
Table 14.6
The linear regression equation is y-hat = 1166.93 – 0.5868x
Exercise 14.1.31
(Solution on p. 669.)
What was the expected farm population (in millions of persons) for 1980?
A. 7.2
B. 5.1
C. 6.0
D. 8.0
Exercise 14.1.32
(Solution on p. 669.)
In linear regression, which is the best possible SSE?
A. 13.46
B. 18.22
C. 24.05
D. 16.33
Exercise 14.1.33
(Solution on p. 669.)
In regression analysis, if the correlation coefficient is close to 1 what can be said about the best fit
line?
A. It is a horizontal line. Therefore, we can not use it.
B. There is a strong linear pattern. Therefore, it is most likely a good model to be used.
C. The coefficient correlation is close to the limit. Therefore, it is hard to make a decision.
D. We do not have the equation. Therefore, we can not say anything about it.
Question 34-36 refer to the following:
A study of the career plans of young women and men sent questionnaires to all 722 members of the senior
class in the College of Business Administration at the University of Illinois. One question asked which
major within the business program the student had chosen. Here are the data from the students who
responded.
Available for free at Connexions <http://cnx.org/content/col10522/1.40>
APPENDIX
621
Female
Male
Accounting
68
56
Administration
91
40
Ecomonics
5
6
Finance
61
59
Table 14.7: Does the data suggest that there is a relationship between the gender of students and their
choice of major?
Exercise 14.1.34
(Solution on p. 669.)
The distribution for the test is:
A. Chi28
B. Chi23
C. t721
D. N (0, 1)
Exercise 14.1.35
(Solution on p. 669.)
The expected number of female who choose Finance is :
A. 37
B. 61
C. 60
D. 70
Exercise 14.1.36
(Solution on p. 669.)
The p-value is 0.0127 and the level of significance is 0.05. The conclusion to the test is:
A. There is insufficient evidence to conclude that the choice of major and the gender of the student
are not independent of each other.
B. There is sufficient evidence to conclude that the choice of major and the gender of the student
are not independent of each other.
C. There is sufficient evidence to conclude that students find Economics very hard.
D. There is in sufficient evidence to conclude that more females prefer Administration than males.
Exercise 14.1.37
(Solution on p. 669.)
An agency reported that the work force nationwide is composed of 10% professional, 10% clerical,
30% skilled, 15% service, and 35% semiskilled laborers. A random sample of 100 San Jose residents
indicated 15 professional, 15 clerical, 40 skilled, 10 service, and 20 semiskilled laborers. At α = .10
does the work force in San Jose appear to be consistent with the agency report for the nation?
Which kind of test is it?
A. Chi2 goodness of fit
B. Chi2 test of independence
C. Independent groups proportions
D. Unable to determine
Available for free at Connexions <http://cnx.org/content/col10522/1.40>
622
APPENDIX
14.2 Practice Final Exam 22
Exercise 14.2.1
(Solution on p. 669.)
A study was done to determine the proportion of teenagers that own a car. The population
proportion of teenagers that own a car is the
A. statistic
B. parameter
C. population
D. variable
The next two questions refer to the following data:
value
frequency
0
1
1
4
2
7
3
9
6
4
Table 14.8
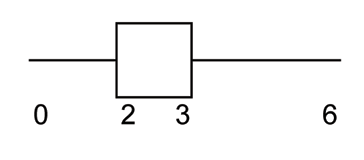
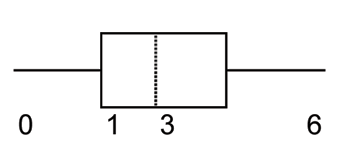
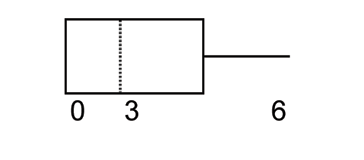
Exercise 14.2.2
(Solution on p. 669.)
The box plot for the data is:
A.
B.
C.
2This content is available online at <http://cnx.org/content/m16303/1.16/>.
Available for free at Connexions <http://cnx.org/content/col10522/1.40>
APPENDIX
623
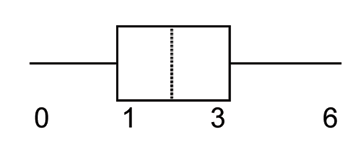
D.
Exercise 14.2.3
(Solution on p. 669.)
If 6 were added to each value of the data in the table, the 15th percentile of the new list of values
is:
A. 6
B. 1
C. 7
D. 8
The next two questions refer to the following situation:
Suppose that the probability of a drought in any independent year is 20%. Out of those years in which a
drought occurs, the probability of water rationing is 10%. However, in any year, the probability of water
rationing is 5%.
Exercise 14.2.4
(Solution on p. 669.)
What is the probability of both a drought and water rationing occurring?
A. 0.05
B. 0.01
C. 0.02
D. 0.30
Exercise 14.2.5
(Solution on p. 669.)
Which of the following is true?
A. drought and water rationing are independent events
B. drought and water rationing are mutually exclusive events
C. none of the above
The next two questions refer to the following situation:
Suppose that a survey yielded the following data:
Favorite Pie Type
gender
apple
pumpkin
pecan
female
40
10
30
male
20
30
10
Table 14.9
Exercise 14.2.6
(Solution on p. 669.)
Suppose that one individual is randomly chosen. The probability that the person’s favorite pie is
apple or the person is male is:
Available for free at Connexions <http://cnx.org/content/col10522/1.40>
624
APPENDIX
A. 40
60
B. 60
140
C. 120
140
D. 100
140
Exercise 14.2.7
(Solution on p. 669.)
Suppose Ho is: Favorite pie type and gender are independent.
The p-value is:
A. ≈ 0
B. 1
C. 0.05
D. cannot be determined
The next two questions refer to the following situation:
Let’s say that the probability that an adult watches the news at least once per week is 0.60. We randomly
survey 14 people. Of interest is the number that watch the news at least once per week.
Exercise 14.2.8
(Solution on p. 669.)
Which of the following statements is FALSE?
A. X ∼ B (14, 0.60)
B. The values for x are: {1, 2, 3, ..., 14}
C. µ = 8.4
D. P (X = 5) = 0.0408
Exercise 14.2.9
(Solution on p. 669.)
Find the probability that at least 6 adults watch the news.
A. 6
14
B. 0.8499
C. 0.9417
D. 0.6429
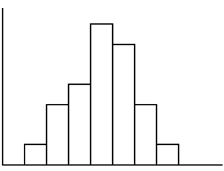
Exercise 14.2.10
(Solution on p. 669.)
The following histogram is most likely to be a result of sampling from which distribution?
Available for free at Connexions <http://cnx.org/content/col10522/1.40>
APPENDIX
625
A. Chi-Square with df = 6
B. Exponential
C. Uniform
D. Binomial
The ages of campus day and evening students is known to be normally distributed. A sample of 6 campus
day and evening students reported their ages (in years) as: {18, 35, 27, 45, 20, 20}
Exercise 14.2.11
(Solution on p. 670.)
What is the error bound for the 90% confidence interval of the true average age?
A. 11.2
B. 22.3
C. 17.5
D. 8.7
Exercise 14.2.12
(Solution on p. 670.)
If a normally distributed random variable has µ = 0 and σ = 1 , then 97.5% of the population
values lie above:
A. -1.96
B. 1.96
C. 1
D. -1
The next three questions refer to the following situation:
The amount of money a customer spends in one trip to the supermarket is known to have an exponential
distribution. Suppose the average amount of money a customer spends in one trip to the supermarket is
$72.
Exercise 14.2.13
(Solution on p. 670.)
What is the probability that one customer spends less than $72 in one trip to the supermarket?
A. 0.6321
Available for free at Connexions <http://cnx.org/content/col10522/1.40>
626
APPENDIX
B. 0.5000
C. 0.3714
D. 1
Exercise 14.2.14