The gradient of a straight line graph is calculated as:

for two points  and
and  on the graph.
We can now define the average gradient between two points even if they are defined by a function which is not a straight line,  and
and  as:
as:

This is the same as Equation 11.1.
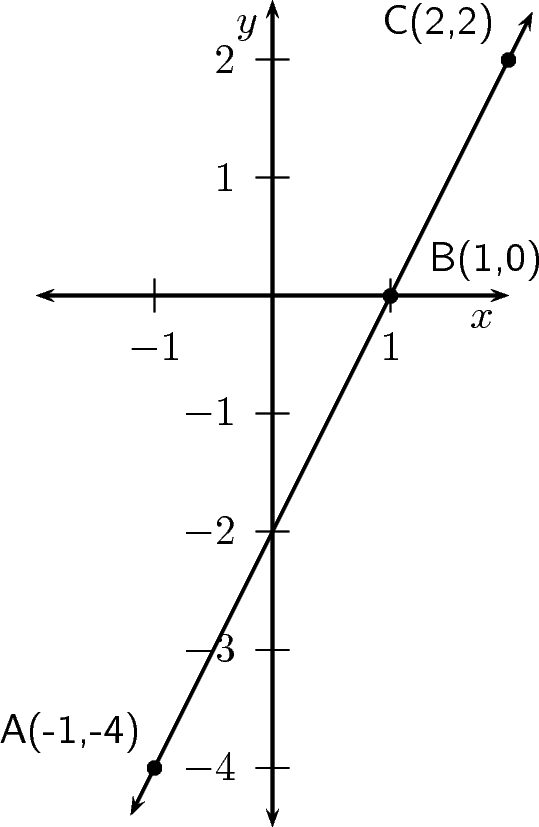
Fill in the table by calculating the average gradient over the indicated intervals for the function f(x)=2x–2. Note that (x1;y1) is the co-ordinates of the first point and (x2;y2) is the co-ordinates of the second point. So for AB, (x1;y1) is the co-ordinates of point A and (x2;y2) is the co-ordinates of point B.
| x1 | x2 | y1 | y2 |

| |
| A-B | |||||
| A-C | |||||
| B-C |
What do you notice about the gradients over each interval?
The average gradient of a straight-line function is the same over any two intervals on the function.
Fill in the table by calculating the average gradient over the indicated intervals for the function f(x)=2x–2:
| x1 | x2 | y1 | y2 |

| |
| A-B | |||||
| B-C | |||||
| C-D | |||||
| D-E | |||||
| E-F | |||||
| F-G |
What do you notice about the average gradient over each interval? What can you say about the average gradients between A and D compared to the average gradients between D and G?
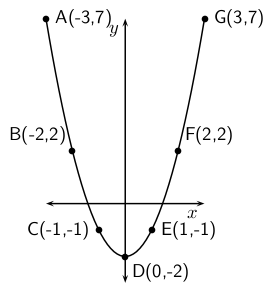
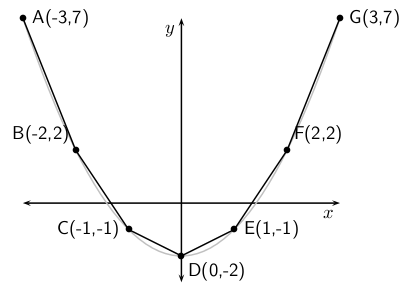
The average gradient of a parabolic function depends on the interval and is the gradient of a straight line that passes through the points on the interval.
For example, in Figure 11.3 the various points have been joined by straight-lines. The average gradients between the joined points are then the gradients of the straight lines that pass through the points.
Given the equation of a curve and two points (x1, x2):
Write the equation of the curve in the form y=....
Calculate y1 by substituting x1 into the equation for the curve.
Calculate y2 by substituting x2 into the equation for the curve.
Calculate the average gradient using:

Find the average gradient of the curve y=5x2–4 between the points x=–3 and x=3
Label the points as follows:
to make it easier to calculate the gradient.
We use the equation for the curve to calculate the y-value at x1 and x2.


Calculate the average gradient :

The average gradient between x=–3 and x=3 on the curve y=5x2–4 is 0.
We can extend the concept of average gradient to any function. The average gradient for any function also depends on the interval chosen and is the gradient of a straight line that passes through the two points. So we can use the formula that we found for the average gradient of parabolic functions and apply it to any function. We will consider the average gradient of just two functions here: exponential functions and hyperbolic functions.
For example, if we were asked to find the average gradient of the function g(x)=3.2x+2 between the points (–4;2,2) and (–0,6;4). This is shown in Figure 11.4.
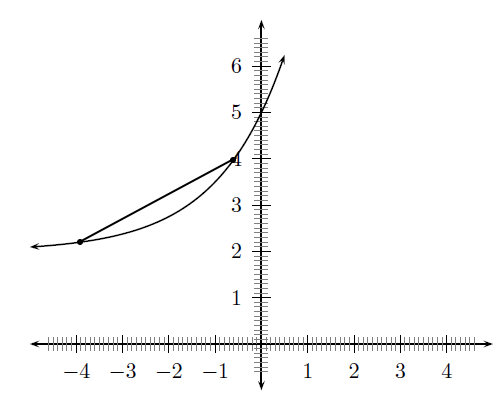
Using the formula we find:

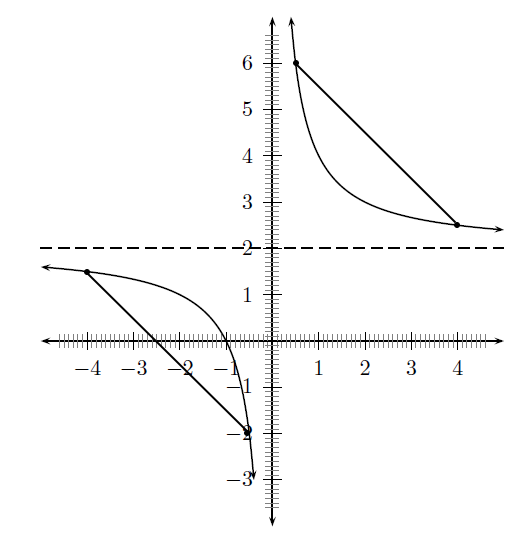
For example, if we were asked to find the average gradient of the function  between the points (–4;–2,5) and (0,5;6) and (–4;2,2) and (–0,6;4). This is shown in Figure 11.5.
For the first point we would get:

Similarly for the second points we would find that the average gradient is: 0,53
The average gradient between two points is: 
The average gradient of a straight-line function is the same over any two intervals on the function
The average gradient of a parabolic function depends on the interval and is the gradient of a straight line that passes through the points on the interval
We can extend the concept of average gradient to any function
An object moves according to the function d=2t2+1 , where d is the distance in metres and t the time in seconds. Calculate the average speed of the object between 2 and 3 seconds. The speed is the gradient of the function d
Click here for the solution
Given: f(x)=x3–6x.
Determine the average gradient between the points where x=1 and x=4.
Click here for the solution
Find the average gradient of each of the following functions between the points where x=2 and x=3
f(x)=x2+3

f(x)=2x–3