Information in the form of numbers, graphs and tables is all around us; on television, on the radio or in the newspaper. We are exposed to crime rates, sports results, rainfall, government spending, rate of HIV/AIDS infection, population growth and economic growth.
This chapter demonstrates how Mathematics can be used to manipulate data, to represent or misrepresent trends and patterns and to provide solutions that are directly applicable to the world around us.
Skills relating to the collection, organisation, display, analysis and interpretation of information that were introduced in earlier grades are developed further.
The collection of data has been introduced in earlier grades as a method of obtaining answers to questions about the world around us. This work will be briefly reviewed.
Data refers to the pieces of information that have been observed and recorded, from an experiment or a survey. There are two types of data: primary and secondary. The word "data" is the plural of the word "datum", and therefore one should say, "the data are" and not "the data is".
Data can be classified as primary or secondary, and primary or secondary data can be classified as qualitative or quantitative. Figure 17.1 summarises the classifications of data.
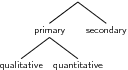
| Primary data: describes the original data that have been collected. This type of data is also known as raw data. Often the primary data set is very large and is therefore summarised or processed to extract meaningful information. |
| Qualitative data: is information that cannot be written as numbers, for example, if you were collecting data from people on how they feel or what their favourite colour is. |
| Quantitative data: is information that can be written as numbers, for example, if you were collecting data from people on their height or weight. |
| Secondary data: is primary data that has been summarised or processed, for example, the set of colours that people gave as favourite colours would be secondary data because it is a summary of responses. |
Transforming primary data into secondary data through analysis, grouping or organisation into secondary data is the process of generating information.
Data is collected to provide answers that help with understanding a particular situation. Here are examples to illustrate some real world data collections scenarios in the categories of qualitative and quantitative data.
The local government might want to know how many residents have electricity and might ask the question: "Does your home have a safe, independent supply of electricity?"
A supermarket manager might ask the question: “What flavours of soft drink should be stocked in my supermarket?" The question asked of customers might be “What is your favourite soft drink?” Based on the customers' responses (i.e. which flavours are chosen), the manager can make an informed decision as to what soft drinks to stock.
A company manufacturing medicines might ask “How effective is our pill at relieving a headache?” The question asked of people using the pill for a headache might be: “Does taking the pill relieve your headache?” Based on responses, the company learns how effective their product is.
A motor car company might want to improve their customer service, and might ask their customers: “How can we improve our customer service?”
A cell phone manufacturing company might collect data about how often people buy new cell phones and what factors affect their choice, so that the cell phone company can focus on those features that would make their product more attractive to buyers.
A town councillor might want to know how many accidents have occurred at a particular intersection, to decide whether a robot should be installed. The councillor would visit the local police station to research their records to collect the appropriate data.
A supermarket manager might ask the question: “What flavours of soft drink should be stocked in my supermarket?" The question asked of customers might be “What is your favourite soft drink?” Based on the customers' responses (i.e. the number of customers who liked soft drink A), the manager can make an informed decision as to what soft drinks to stock.
However, it is important to note that different questions reveal different features of a situation, and that this affects the ability to understand the situation. For example, if the first question in the list was re-phrased to be: "Does your home have electricity?" then if you answered yes, but you were getting your electricity from a neighbour, then this would give the wrong impression that you did not need an independent supply of electricity.
The method of collecting the data must be appropriate to the question being asked. Some examples of data collecting methods are:
Questionnaires, surveys and interviews
Experiments
Other sources (friends, family, newspapers, books, magazines and the Internet)
The most important aspect of each method of data collecting is to clearly formulate the question that is to be answered. The details of the data collection should therefore be structured to take your question into account.
For example, questionnaires, interviews or surveys would be most appropriate for the list of questions in "Purpose of Collecting Primary Data".
Before the data collecting starts, it is important to decide how much data is needed to make sure that the results give an accurate reflection to the required answers. Ideally, the study should be designed to maximise the amount of information collected while minimising the effort. The concepts of populations and samples is vital to minimising effort.
The following terms should be familiar:
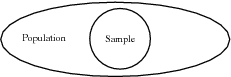
| Population: describes the entire group under consideration in a study. For example, if you wanted to know how many learners in your school got the flu each winter, then your population would be all the learners in your school. |
| Sample: describes a group chosen to represent the population under consideration in a study. For example, for the survey on winter flu, you might select a sample of learners, maybe one from each class. |
| Random sample: describes a sample chosen from a population in such a way that each member of the population has an equal chance of being chosen. |
Choosing a representative sample is crucial to obtaining results that are unbiased. For example, if we wanted to determine whether peer pressure affects the decision to start smoking, then the results would be different if only boys were interviewed, compared to if only girls were interviewed, compared to both boys and girls being interviewed.
Therefore questions like: "How many interviews are needed?" and "How do I select the candidates for the interviews?" must be asked during the design stage of the sampling process.
The most accurate results are obtained if the entire population is sampled for the survey, but this is expensive and time-consuming. The next best method is to randomly select a sample of subjects for the interviews. This means that whatever the method used to select subjects for the interviews, each subject has an equal chance of being selected. There are various methods of doing this for example, names can be picked out of a hat or can be selected by using a random number generator. Most modern scientific calculators have a random number generator or you can find one on a spreadsheet program on a computer.
So, if you had a total population of 1 000 learners in your school and you randomly selected 100, then that would be the sample that is used to conduct your survey.
The remainder of this chapter deals with the mathematical details that are required to analyse the data collected.
The following are some example sets of data which can be used to apply the methods that are being explained.
A fair coin was tossed 100 times and the values on the top face were recorded. The data are recorded in "Data Set 1: Tossing a coin".
| H | T | T | H | H | T | H | H | H | H |
| H | H | H | H | T | H | H | T | T | T |
| T | T | H | T | T | H | T | H | T | H |
| H | H | T | T | H | T | T | H | T | T |
| T | H | H | H | T | T | H | T | T | H |
| H | T | T | T | T | H | T | T | H | H |
| T | T | H | T | T | H | T | T | H | T |
| H | T | T | H | T | T | T | T | H | T |
| T | H | T | T | H | H | H | T | H | T |
| T | T | T | H | H | T | T | T | H | T |
A fair die was cast 100 times and the values on the top face were recorded. The data are recorded in "Data Set 2: Casting a die".
| 3 | 5 | 3 | 6 | 2 | 6 | 6 | 5 | 5 | 6 | 6 | 4 | 2 | 1 | 5 | 3 | 2 | 4 | 5 | 4 |
| 1 | 4 | 3 | 2 | 6 | 6 | 4 | 6 | 2 | 6 | 5 | 1 | 5 | 1 | 2 | 4 | 4 | 2 | 4 | 4 |
| 4 | 2 | 6 | 4 | 5 | 4 | 3 | 5 | 5 | 4 | 6 | 1 |
|