41 ,° a =
,
49
.
2
b = 13
.
3
22. β =
7
.
58 ,° a =
,
6
.
10 c =
7
.
15
23. α =120 ,° b = ,
6 c = 7
24. γ =115 ,° a = ,
18 b = 23
25. Find the area of a triangle with sides of length 18, 21, and 32.
26. Find the area of a triangle with sides of length 20, 26, and 37.
27. To find the distance across a small lake, a surveyor has
taken the measurements shown. Find the distance across
the lake.
800 ft
900 ft
70°
28. To find the distance between two cities, a satellite
calculates the distances and angle shown ( not to
370 km
scale). Find the distance between the cities.
2.1° 350 km
464 Chapter 8
29. To determine how far a boat is from shore, two radar
stations 500 feet apart determine the angles out to the
boat, as shown. Find the distance of the boat from the
station A, and the distance of the boat from shore.
70°
60°
A
B
30. The path of a satellite orbiting the earth causes it to
pass directly over two tracking stations A and B,
which are 69 mi apart. When the satellite is on one
side of the two stations, the angles of elevation at A
and B are measured to be 86.2° and 83.9°,
respectively. How far is the satellite from station A
and how high is the satellite above the ground?
83.9°
86.2°
A
B
31. A communications tower is located at the top of a
steep hill, as shown. The angle of inclination of
the hill is 67°. A guy-wire is to be attached to the
top of the tower and to the ground, 165 m
downhill from the base of the tower. The angle
16°
formed by the guy-wire and the hill is 16°. Find
165m
the length of the cable required for the guy wire.
67°
32. The roof of a house is at a 20° angle. An 8 foot
solar panel is to be mounted on the roof, and
8 ft
should be angled 38° relative to the horizontal
38°
for optimal results. How long does the vertical
support holding up the back of the panel need to
20°
be?
33. A 127 foot tower is located on a hill that is
127 ft
inclined 38° to the horizontal. A guy-wire is to
be attached to the top of the tower and anchored
at a point 64 feet downhill from the base of the
64 ft
tower. Find the length of wire needed.
38°
Section 8.1 Non-Right Triangles: Laws of Sines and Cosines 465
34. A 113 foot tower is located on a hill that is
inclined 34° to the horizontal. A guy-wire is to
be attached to the top of the tower and anchored
at a point 98 feet uphill from the base of the
113 ft
tower. Find the length of wire needed.
98 ft
34°
35. A pilot is flying over a straight highway. He
determines the angles of depression to two
37°
44°
mileposts, 6.6 km apart, to be 37° and 44°, as
shown in the figure. Find the distance of the plane
from point A, and the elevation of the plane.
A
B
36. A pilot is flying over a straight highway. He
32°
determines the angles of depression to two
56°
mileposts, 4.3 km apart, to be 32° and 56°, as
shown in the figure. Find the distance of the plane
from point A, and the elevation of the plane.
A
B
37. To estimate the height of a building, two students find the angle of elevation from a
point (at ground level) down the street from the building to the top of the building is
39°. From a point that is 300 feet closer to the building, the angle of elevation (at
ground level) to the top of the building is 50°. If we assume that the street is level, use
this information to estimate the height of the building.
38. To estimate the height of a building, two students find the angle of elevation from a
point (at ground level) down the street from the building to the top of the building is
35°. From a point that is 300 feet closer to the building, the angle of elevation (at
ground level) to the top of the building is 53°. If we assume that the street is level, use
this information to estimate the height of the building.
39. A pilot flies in a straight path for 1 hour 30 min. She then makes a course correction,
heading 10 degrees to the right of her original course, and flies 2 hours in the new
direction. If she maintains a constant speed of 680 miles per hour, how far is she from
her starting position?
466 Chapter 8
40. Two planes leave the same airport at the same time. One flies at 20 degrees east of
north at 500 miles per hour. The second flies at 30 east of south at 600 miles per
hour. How far apart are the planes after 2 hours?
41. The four sequential sides of a quadrilateral have lengths 4.5 cm, 7.9 cm, 9.4 cm, and
12.9 cm. The angle between the two smallest sides is 117°. What is the area of this
quadrilateral?
42. The four sequential sides of a quadrilateral have lengths 5.7 cm, 7.2 cm, 9.4 cm, and
12.8 cm. The angle between the two smallest sides is 106°. What is the area of this
quadrilateral?
43. Three circles with radii 6, 7, and 8, all touch as shown. Find the shaded
area bounded by the three circles.
44. A rectangle is inscribed in a circle of radius 10 cm as shown. Find the
shaded area, inside the circle but outside the rectangle.
55°
Section 8.2 Polar Coordinates 467
Section 8.2 Polar Coordinates
The coordinate system we are most familiar with is called the Cartesian coordinate
system, a rectangular plane divided into four quadrants by the horizontal and vertical
axes.
y
In earlier chapters, we often found the Cartesian coordinates of
a point on a circle at a given angle from the positive horizontal
axis. Sometimes that angle, along with the point’s distance
x
from the origin, provides a more useful way of describing the
point’s location than conventional Cartesian coordinates.
Polar Coordinates
Polar coordinates of a point consist of an ordered pair, ( r,θ ), where r is the distance
from the point to the origin, and θ is the angle measured in standard position.
Notice that if we were to “grid” the plane for polar coordinates, it
would look like the graph to the right, with circles at incremental radii,
and rays drawn at incremental angles.
Example 1
π
Plot the polar point 5
,
3
.
6
This point will be a distance of 3 from the origin, at an angle of
5π . Plotting this,
6
Example 2
π
Plot the polar point
− ,
2 .
4
Typically we use positive r values, but occasionally we run into
cases where r is negative. On a regular number line, we measure
positive values to the right and negative values to the left. We will
π
plot this point similarly. To start we rotate to an angle of .
4
Moving this direction, into the first quadrant, would be positive r
values. For negative r values, we move the opposite direction, into
the third quadrant. Plotting this:
468 Chapter 8
π
Note the resulting point is the same as the polar point
5
2,
.
4
Try it Now
1. Plot the following points given in polar coordinates and label them.
π
π
π
a. A
3,
=
b. B = 2,
−
c.
3
C = 4,
6
3
4
Converting Points
To convert between polar coordinates and Cartesian coordinates, we recall the
relationships we developed back in Chapter 5.
Converting Between Polar and Cartesian Coordinates
To convert between polar ( r,θ )and Cartesian ( x, y) coordinates,
we use the relationships
( x, y)
x
r
cos(θ ) =
x = r cos(θ )
y
r
θ
y
sin(θ ) =
y = r sin(θ )
x
ry
tan(θ ) =
2
2
2
x + y = r
x
π
From these relationship and our knowledge of the unit circle, if r = 1 and θ = , the
3
π
polar coordinates would be ( r,θ )
1,
=
, and the corresponding Cartesian
3
coordinates
1 3
( x, y) = ,
.
2 2
Remembering your unit circle values will come in very handy as you convert between
Cartesian and polar coordinates.
Section 8.2 Polar Coordinates 469
Example 3
π
Find the Cartesian coordinates of a point with polar coordinates
2
( r,θ ) = ,
5
.
3
To find the x and y coordinates of the point,
2π
1
5
x = r cos(θ ) = 5cos
= 5− = −
3
2
2
2π
3 5 3
y = r sin(θ ) = 5sin
= 5
=
3
2
2
5 5 3
The Cartesian coordinates are − ,
.
2 2
Example 4
Find the polar coordinates of the point with Cartesian coordinates (− ,
3 − )
4 .
We begin by finding the distance r using the Pythagorean relationship 2
2
2
x + y = r
2
2
2
(− )
3 + ( 4
− ) = r
2
9 +16 = r
2
r = 25
r = 5
Now that we know the radius, we can find the angle using any of the three trig
relationships. Keep in mind that any of the relationships will produce two solutions on
the circle, and we need to consider the quadrant to determine which solution to accept.
Using the cosine, for example:
x − 3
cos(θ ) = =
r
5
− − 3
θ = cos 1
≈ 2 214
.
By symmetry, there is a second possibility at
5
θ = 2π − .
2 214 = .
4 069
Since the point (-3, -4) is located in the 3rd quadrant, we can determine that the second
angle is the one we need. The polar coordinates of this point are ( r,θ ) = ,
5
( 4
)
069
.
.
Try it Now
2. Convert the following.
a. Convert polar coordinates ( r,θ ) = (2,π ) to ( x, y).
b. Convert Cartesian coordinates ( x, y) = (0, 4
− ) to ( r,θ ).
470 Chapter 8
Polar Equations
Just as a Cartesian equation like
2
y = x describes a relationship between x and y values
on a Cartesian grid, a polar equation can be written describing a relationship between r
and θ values on the polar grid.
Example 5
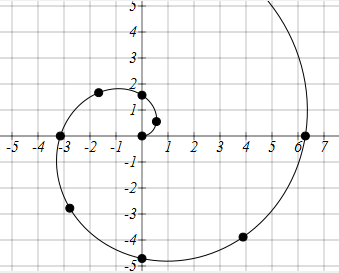
Sketch a graph of the polar equation r = θ .
The equation r =θ describes all the points for which the radius r is equal to the angle.
To visualize this relationship, we can create a table of values.
θ
0
π/4
π/2
3π/4
π
5π/4
3π/2
7π/4
2π
r
0
π/4
π/2
3π/4
π
5π/4
3π/2
7π/4
2π
We can plot these points on the plane, and then sketch a
curve that fits the points. The resulting graph is a spiral.
Notice that the resulting graph cannot be the result of a
function of the form y = f(x), as it does not pass the
vertical line test, even though it resulted from a function
giving r in terms of θ.
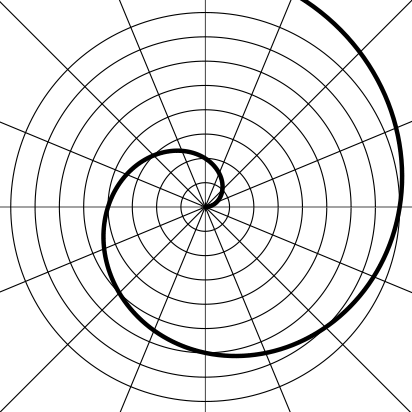
Although it is nice to see polar equations on polar
grids, it is more common for polar graphs to be
graphed on the Cartesian coordinate system, and so,
the remainder of the polar equations will be graphed
accordingly.
The spiral graph above on a Cartesian grid is shown
here.
Example 6
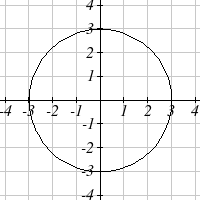
Sketch a graph of the polar equation r = 3.
Recall that when a variable does not show up in the equation, it
is saying that it does not matter what value that variable has;
the output for the equation will remain the same.
For example, the Cartesian equation y = 3 describes all the
points where y = 3, no matter what the x values are, producing
a horizontal line.
Likewise, this polar equation is describing all the points at a distance of 3 from the
origin, no matter what the angle is, producing the graph of a circle.
Section 8.2 Polar Coordinates 471
The normal settings on graphing calculators and software graph on the Cartesian
coordinate system with y being a function of x, where the graphing utility asks for f(x), or simply y =.
To graph polar equations, you may need to change the mode of your calculator to Polar.
You will know you have been successful in changing the mode if you now have r as a
function of θ, where the graphing utility asks for r(θ), or simply r =.
Example 7
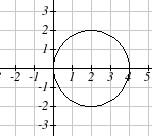
Sketch a graph of the polar equation r = 4cos(θ ) , and find an
interval on which it completes one cycle.
While we could again create a table, plot the corresponding
points, and connect the dots, we can also turn to technology to
directly graph it. Using technology, we produce the graph shown
here, a circle passing through the origin.
Since this graph appears to close a loop and repeat itself, we might ask what interval of
θ values yields the entire graph. At θ = 0, r = 4cos( )
0 = 4 . We would then consider
the next θ value when r will be 4, which would mean we are back where we started.
Solving,
4 = 4cos(θ )
cos(θ ) = 1
θ = 0 or θ = π
This shows us at 0 radians we are at the point (0, 4), and again atπ radians we are at the
point (0, 4) having finished one complete revolution.
The interval 0≤θ <π yields one complete iteration of the circle.
Try it Now
3. Sketch a graph of the polar equation r = 3sin(θ ) , and find an interval on which it
completes one cycle.
The last few examples have all been circles. Next we will consider two other “named”
polar equations, limaçons and roses.
Example 8
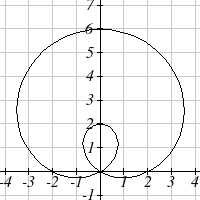
Sketch a graph of the polar equation r = 4sin(θ ) + 2 . What interval of θ values
corresponds to the inner loop?
This type of graph is called a limaçon.
472 Chapter 8
Using technology, we can draw a graph. The inner loop begins
and ends at the origin, where r = 0. We can solve for the θ
values for which r = 0.
0 = 4sin(θ)+2
− 2 = 4sin(θ )
1
sin(θ ) = −
2
7π
θ =
or
11π
θ =
6
6
This tells us that r = 0, or the graph passes through the origin, twice on the interval
[0, 2π).
π
π
The inner loop arises from the interval 7
11
≤ θ ≤
. This corresponds to where the
6
6
function r = 4sin(θ ) + 2 takes on negative values.
Example 9
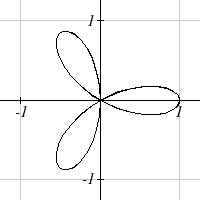
Sketch a graph of the polar equation r = co 3
s( θ ) . What
interval of θ values describes one small loop of the graph?
This type of graph is called a 3 leaf rose.
Again we can use technology to produce a graph. The interval
[0, π) yields one cycle of this function. As with the last
problem, we can note that there is an interval on which one
loop of this graph begins and ends at the origin, where r = 0.
Solving for θ,
0=co 3s(θ)
Substitute u = 3 θ
0 = cos( u)
π
u = or
3π
u =
or
5π
u =
2
2
2
Undo the substitution
π
π
π
3θ =
or
3
3θ =
or
5
3θ =
2
2
2
π
θ
π
=
or
θ =
or
5π
θ =
6
2
6
There are 3 solutions on 0≤θ <π which correspond to the 3 times the