Write
2
f ( x) = 3+ 5 − x as the composition of two functions.
We are looking for two functions, g and h, so f( x)= g( h( x)). To do this, we look for a function inside a function in the formula for f(x). As one possibility, we might notice
that
2
5 − x is the inside of the square root. We could then decompose the function as:
2
h( x) = 5 − x
g( x) = 3+ x
We can check our answer by recomposing the functions:
g( h( x)) = g(
2
5 − x )
2
= 3+ 5 − x
Note that this is not the only solution to the problem. Another non-trivial
decomposition would be
2
h( x) = x and g( x) = 3+ 5 − x
Important Topics of this Section
Definition of Composition of Functions
Compositions using:
Words
Tables
Graphs
Equations
56 Chapter 1
Try it Now Answers
1. The final cost, C, depends on the clearance price, p, which is based on the original
discount, d. (Or the original discount d, determines the clearance price and the final
cost is half of the clearance price.)
2. f ( g(1)) = f (3) = 3
and g( f (3)) = g(3) = 2
3. g( f (2)) = g(5) = 3
4. h( f ( 2)
− ) = h(6) = 20 did you remember to insert your input values using parentheses?
5. g( t − 2) = 3( t − 2) − ( t − 2)
3
6. f ( g( x)) = f ( x) = ( x) +3( x)
g f x = g ( 3
x + x) = ( 3
( ( ))
3
x + 3 x)
Section 1.4 Composition of Functions 57
Section 1.4 Exercises
Given each pair of functions, calculate f ( g (0)) and g ( f (0)) .
1. f ( x) = 4 x + 8, g ( x)
2
= 7 − x
2. f ( x) = 5 x + 7, g ( x)
2
= 4 − 2 x
3. f ( x) = x + 4 , g ( x)
3
= 12 − x
4. f ( x)
1
=
, g ( x) = 4 x + 3
x + 2
Use the table of values to evaluate each expression
x f ( x)
g( x)
5. f ( g(8))
0
7
9
6. f ( g (5))
1
6
5
7. g( f (5))
2
5
6
8. g ( f (3))
3
8
2
4
4
1
9. f ( f (4))
5
0
8
10. f ( f ( )
1 )
6
2
7
11. g( g(2))
7
1
3
8
9
4
12. g ( g (6))
9
3
0
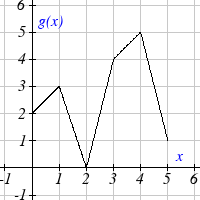
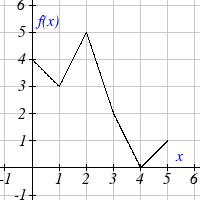
Use the graphs to evaluate the expressions below.
13. f ( g(3))
14. f ( g ( )
1 )
15. g( f (1))
16. g ( f (0))
17. f ( f (5))
18. f ( f (4))
19. g( g(2))
20. g ( g (0))
For each pair of functions, find f ( g ( x)) and g ( f ( x)). Simplify your answers.
21. f ( x)
1
=
, g ( x) 7
= + 6
22. f ( x)
1
=
, g ( x) 2
= + 4
x − 6
x
x − 4
x
23. f ( x)
2
= x +1, g ( x) = x + 2
24. f ( x) = x + 2 , g ( x)
2
= x + 3
58 Chapter 1
+
25. f ( x) = x , g ( x) = 5 x +1
26. ( ) 3
f x = x , g ( x) x 1
=
3
x
27. If f ( x)
4
=
x + 6, g( x)
= x − 6 and h( x)
= x , find f ( g( h( x)))
28. If f ( x)
2
=
x +1, ( ) 1
g x = and h( x) =
x + 3 , find f ( g( h( x)))
x
29. Given functions ( )
1
p x =
and m( x)
2
=
x − 4 , state the domains of the following
x
functions using interval notation.
p( x)
a. Domain of
m( x)
b. Domain of p( m( x))
c. Domain of m( p( x))
30. Given functions ( )
1
q x =
and h( x)
2
=
x − 9 , state the domains of the following
x
functions using interval notation.
q( x)
a. Domain of
h( x)
b. Domain of q( h( x))
c. Domain of h( q( x))
31. The function D( p) gives the number of items that will be demanded when the price
is p. The production cost, C( x) is the cost of producing x items. To determine the cost of production when the price is $6, you would do which of the following:
a. Evaluate D( C(6))
b. Evaluate C( D(6))
c. Solve D( C( x)) = 6
d. Solve C( D( p)) = 6
32. The function (
A d) gives the pain level on a scale of 0-10 experienced by a patient
with d milligrams of a pain reduction drug in their system. The milligrams of drug in
the patient’s system after t minutes is modeled by m( t) . To determine when the
patient will be at a pain level of 4, you would need to:
a. Evaluate A( m(4))
b. Evaluate m( A(4))
c. Solve A( m( t)) = 4
d. Solve m( A( d )) = 4
Section 1.4 Composition of Functions 59
33. The radius r, in inches, of a spherical balloon is related to the volume, V, by
3 V
= 3
r( V )
. Air is pumped into the balloon, so the volume after t seconds is given
4π
by V ( t) =10 + 20 t .
a. Find the composite function r ( V ( t))
b. Find the time when the radius reaches 10 inches.
34. The number of bacteria in a refrigerated food product is given by
N ( T )
2
= 23 T − 56 T +1 , 3 < T < 33, where T is the temperature of the food. When the food is removed from the refrigerator, the temperature is given by T( t) = 5 t +1.5 , where t is the time in hours.
a. Find the composite function N ( T ( t))
b. Find the time when the bacteria count reaches 6752
Find functions f( x) and g( x) so the given function can be expressed as
h( x) = f ( g ( x)).
35. h( x) = ( x + )2
2
36. h( x) = ( x − )3
5
37. h( x)
3
=
38. h( x)
4
=
x − 5
( x + 2)2
39. h( x) = 3+ x − 2
40. h( x)
3
= 4 + x
41. Let f ( x) be a linear function, with form f ( x) = ax + b for constants a and b. [UW]
a. Show that f ( f ( x)) is a linear function
b. Find a function g( x) such that g ( g ( x)) = 6 x −8
42. Let f ( x) 1
= x + 3 [UW]
2
a. Sketch the graphs of f ( x), f ( f ( x))
, f ( f ( f (
x))) on the interval −2 ≤ x ≤ 10.
b. Your graphs should all intersect at the point (6, 6). The value x = 6 is called a
fixed point of the function f(x) since f (6) = 6 ; that is, 6 is fixed - it doesn’t move
when f is applied to it. Give an explanation for why 6 is a fixed point for any
function f ( f ( f (... f ( x)...))) .
c. Linear functions (with the exception of f ( x) = x ) can have at most one fixed point. Quadratic functions can have at most two. Find the fixed points of the
function g ( x)
2
= x − 2 .
d. Give a quadratic function whose fixed points are x = −2 and x = 3.
60 Chapter 1
43. A car leaves Seattle heading east. The speed of the car in mph after m minutes is
2
given by the function ( )
70 m
C m =
. [UW]
2
10 + m
a. Find a function m = f ( s) that converts seconds s into minutes m. Write out the formula for the new function C( f ( s)) ; what does this function calculate?
b. Find a function m = g( h ) that converts hours h into minutes m. Write out the formula for the new function C( g( h)) ; what does this function calculate?
c. Find a function z = v( s) that converts mph s into ft/sec z. Write out the formula for the new function v( C( m) ; what does this function calculate?

Section 1.5 Transformation of Functions 61
Section 1.5 Transformation of Functions
Often when given a problem, we try to model the scenario using mathematics in the form
of words, tables, graphs and equations in order to explain or solve it. When building
models, it is often helpful to build off of existing formulas or models. Knowing the basic
graphs of your tool-kit functions can help you solve problems by being able to model
new behavior by adapting something you already know. Unfortunately, the models and
existing formulas we know are not always exactly the same as the ones presented in the
problems we face.
Fortunately, there are systematic ways to shift, stretch, compress, flip and combine
functions to help them become better models for the problems we are trying to solve. We
can transform what we already know into what we need, hence the name,
“Transformation of functions.” When we have a story problem, formula, graph, or table,
we can then transform that function in a variety of ways to form new functions.
Shifts
Example 1
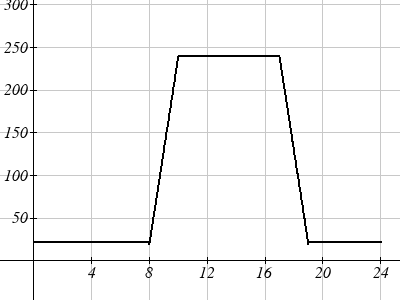
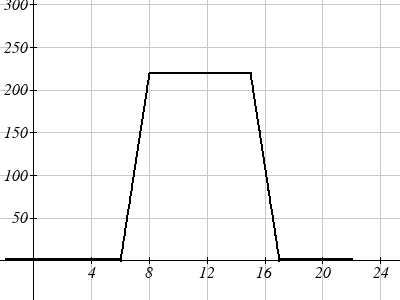
To regulate temperature in our green building, air flow vents near the roof open and
close throughout the day to allow warm air to escape. The graph below shows the open
vents V (in square feet) throughout the day, t in hours after midnight. During the
summer, the facilities staff decides to try to better regulate temperature by increasing
the amount of open vents by 20 square feet throughout the day. Sketch a graph of this
new function.
We can sketch a graph of this new function by adding 20 to each of the output values of
the original function. This will have the effect of shifting the graph up.
62 Chapter 1
Notice that in the second graph, for each
input value, the output value has
increased by twenty, so if we call the
new function S(t), we could write
S( t) = V ( t) + 20 .
Note that this notation tells us that for
any value of t, S(t) can be found by
evaluating the V function at the same
input, then adding twenty to the result.
This defines S as a transformation of the
function V, in this case a vertical shift
up 20 units.
Notice that with a vertical shift the input values stay the same and only the output
values change.
Vertical Shift
Given a function f(x), if we define a new function g(x) as
g( x) = f ( x) + k , where k is a constant
then g(x) is a vertical shift of the function f(x), where all the output values have been increased by k.
If k is positive, then the graph will shift up
If k is negative, then the graph will shift down
Example 2
A function f(x) is given as a table below. Create a table for the function g( x) = f ( x) − 3
x 2 4 6 8
f(x) 1
3
7
11
The formula g( x) = f ( x) − 3 tells us that we can find the output values of the g function by subtracting 3 from the output values of the f function. For example,
f (2) =1
is found from the given table
g( x) = f ( x) − 3
is our given transformation
g(2) = f (2) − 3 =1− 3 = 2
−
Subtracting 3 from each f(x) value, we can complete a table of values for g(x)
x 2 4 6 8
g(x) -2
0
4
8
Section 1.5 Transformation of Functions 63
As with the earlier vertical shift, notice the input values stay the same and only the output
values change.
Try it Now
1. The function
2
h( t) = 4.9
−
t + 30 t gives the height h of a ball (in meters) thrown
upwards from the ground after t seconds. Suppose the ball was instead thrown from the
top of a 10 meter building. Relate this new height function b(t) to h(t), then find a
formula for b(t).
The vertical shift is a change to the output, or outside, of the function. We will now look
at how changes to input, on the inside of the function, change its graph and meaning.
Example 3
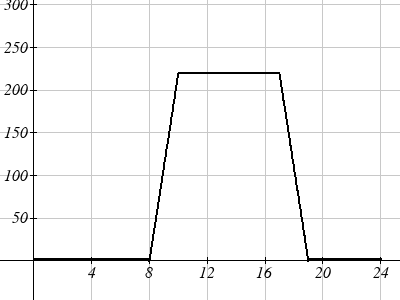
Returning to our building air flow example from the beginning of the section, suppose
that in Fall, the facilities staff decides that the original venting plan starts too late, and
they want to move the entire venting program to start two hours earlier. Sketch a graph
of the new function.
V(t) = the original venting plan F(t) = starting 2 hrs sooner In the new graph, which we can call F(t), at each time, the air flow is the same as the
original function V(t) was two hours later. For example, in the original function V, the
air flow starts to change at 8am, while for the function F(t) the air flow starts to change
at 6am. The comparable function values are V (8) = F(6) .
Notice also that the vents first opened to 220 sq. ft. at 10 a.m. under the original plan,