Chapter IV
4.1. What is a Technical Indicator?
Technical indicators are calculations which are based on the price and volume of a security.
They are used both to confirm the trend and the quality of chart patterns, and to help traders determine the buy and sell signals.
Indicators are used to identify trends, volatility, momentum and other aspects in a security to help in the trend’s technical analysis. They can be applied separately to form buy and sell signals, as well as can be used together, in conjunction with chart patterns and price movement.
4.2. Various Classifications of Technical Indicators
There are two leading groups of indicators: leading indicators and lagging indicators. Leading indicators precede price movement performing a predictive function. They are effective to be used during sideways trend or non-trending treading ranges. Lagging indicators, on the other hand, follow the price movement serving as a confirmation tool. These indicators are mainly used during trending periods (bullish or bearish).
By their form indicators either fall in a bounded range or not. Those indicators that are bound within a range are known as oscillators, which are also considered the most common type of indicators.
Range here means the difference between high and low prices over a set time period. It shows the price volatility and price spread for a specific period.
Oscillators are used in non-trending markets where price fluctuates in a trading range creating a market situation where most trend –following tools don’t work effectively. They help traders profit from periodic sideways and trendless market. The oscillator becomes most useful when the price reaches near the upper or lower end of boundaries. The market is overbought when it is near the upper extreme, and oversold when it reaches the lower extreme.
Indicators can form buy and sell signals through crossovers and divergence. Crossovers are reflected when price moves through the moving average or when two different moving averages cross each other. Divergence happens when the price trend and the indicator trend move in opposite directions indicating that the direction of price trend is weakening.
4.3. Major Technical Indicators
There is a wide variety of technical indicators designed to signal certain actions in the market.
However, not all of them are used widely by traders. The following indicators discussed below are of utmost importance for analysts and at least one of them is used by each trader.
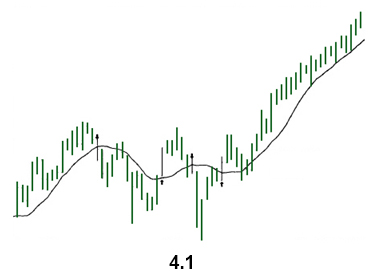
Moving Average: MA is one of the widely used of all technical indicators. As its name implies, it indicates the average price of a security over a defined time period. Its purpose is to signal that a new trend has begun, or the old trend has been reversed. It is used to track the trend, therefore it is a lagging indicator. Moving averages can be used to determine whether the security moves in a downtrend or in an uptrend based on the direction of the moving average. If a moving average is heading upward, the security is in an uptrend. If a moving average is moving downward, the security is in a downtrend (see figure 4.1 ).
There are different types of moving averages that vary in the way they are calculated, but all they are interpreted in the same way. The three well known types of moving averages are: simple, linear and exponential.
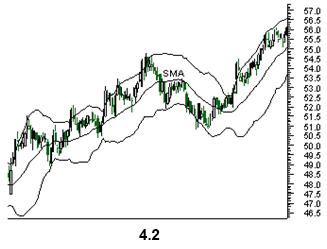
Simple Moving Average (SMA): SMA takes the sum of all past closing prices over the specified time frame and divides the result by the number of prices in the calculation. One of the best ways to measure the strength of the long-term trend and make a forecasting that it will reverse is to increase the number of time periods.
Linear Weighted Average: This indicator is less popular and is used to correct the weighting problem. To calculate this, the sum of all the closing prices over a defined time period is multiplied by the position of the data point and then divided by the sum of the number of periods.
Exponential Moving Average (EMA): The most essential point to note in EMA is that it is more responsive to new information than the SMA. This responsiveness is one of the main reasons why this type of moving average is of choice among traders.
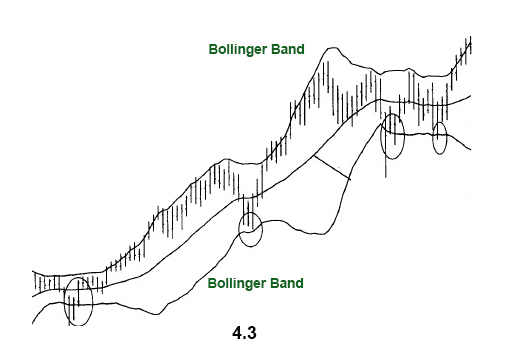
Bollinger Bands: This technique was developed by John Bollinger. The two trading bands are plotted around the moving average; the closer the prices to the lower band, the more oversold is the market, and the closer the price moves to the upper band, the more overbought is the market. When the market becomes more volatile, the bands move further away from the moving average, becoming wider. During less volatile periods the bands move closer to the average becoming narrower. The narrowing of bands is often used by chartists as a signal that the volatility is going to increase.
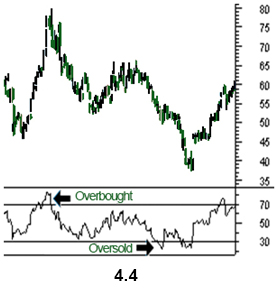
Relative Strength Index (RSI): RSI is another well known indicator which was developed by J. Welles Wilder, Jr. It helps to signal the overbought and oversold conditions in a security. It is plotted in a range between 0 and 100.
A reading below 30 indicates that the security is oversold, and a reading above 70 suggests that the security is oversold. Because of the changes that take place in bull and bear markets, the 80 level is usually considered overbought in bul markets, and the 20 level is referred to as an oversold level in bear markets.
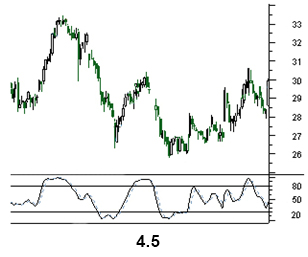
Stochastic Oscillator : The stochastic oscillator was popularized by George Lane. It is based on the main idea that as prices increase, closing prices should be near the highs of the price range, signaling upward momentum in the security. On the other hand, in downtrends, the closing prices tend to be near the lows of the price range, signaling downward momentum. The stochastic oscillator like the ADX is plotted within a range of 0 and 100 and signals oversold conditions below 20 and overbought conditions above 80 (see figure 4.5).
Two lines are used in Stochastic process-the %K line and the %D line. The former is more sensitive and is the raw measure used to formulate the idea of momentum. The latter is considered a moving average of the %K. The %D is more important and provides the major signals. Though this indicator requires the past 14 trading periods in its calculation, it can be adjusted to meet the needs of the user.
Moving Average Convergence/Divergence (MACD): MACD was developed by Gerald Appel. This indicator consists of two exponential moving averages and helps to measure momentum in the security.
It shows the difference between two moving averages of closing prices and the centerline (the point at which two moving averages are equal). Aside from the MACD and the centerline, an exponential moving average of the MACD is plotted on the chart.
This indicator is used to measure the short –term momentum compared to longer term momentum:
MACD=short-term moving average – long- term moving average
If the MACD is positive, this means that the shorter term moving average is above the longer term moving average and an upward movement is expected.
Conversely, negative MACD signals that the shorter term moving average is below the longer-term moving average and suggests a downward momentum. A crossing in the moving averages takes place when the MACD line crosses over the centerline.
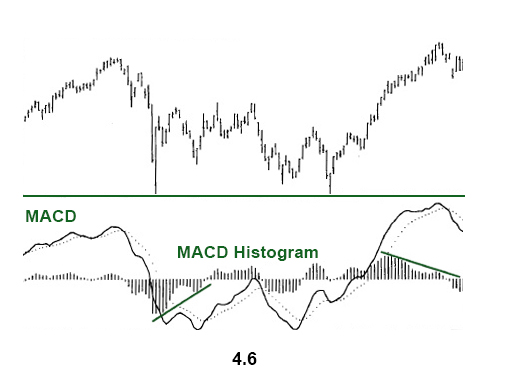
When the MACD line crosses above the signal line (dotted line) buy signal is generated. When the MACD crosses below the signal line a sell signal is generated (see figure 4.6).
A very important aspect of the MACD indicator is the MACD histogram which is plotted on the centerline and is shown by vertical bars. It indicates the difference between two MACD lines. When the MACD lines are positive, the histogram is above the zero line. When the histogram is over the zero line, but starts to fall , the uptrend is weakening. When the histogram is below the zero line and starts to move upward, the downtrend is weakening.
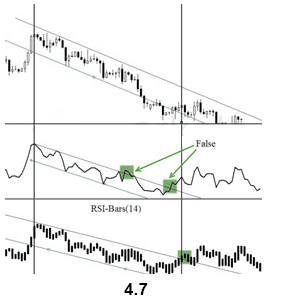
RSI-Bars: RSI-Bars is an oscillator, developed by IFC Markets in 2014. It as the modification of Relative Strength Index (RSI). RSI-Bars characterizes a stability of a price momentum and allows a definition of a trend potential.
A distinctive feature of RSI-Bars is that this indicator takes into account the volatility of a considered instrument within the selected timeframe - values of RSI-Bars are defined taking into account the price values OPEN/HIGH/LOW/CLOSE (OHLC) and are displayed in the form of chart bars. This allows avoiding of false breakdowns of oscillator trend lines and that’s why traders may use methods of a chart analysis more efficiently in this case.
Technical indicators are primarily designed for analyzing short term market movements and, therefore, are most extensively used by active traders. For long-term traders most indicators are of little value; they can help to identify good entry and exit points for the security by analyzing the long-term trend.