510
2008-09
3.30
1.24
425
Source: Directorate of pulses development Bhopal
2. Insect pests and their associated natural enemies
2.1 Qualitative and quantitative abundance
Methodology used to quantify major insect pests of green gram and the associated natural
enemies:
Study on population dynamics of insect pests and natural enemies:
i. Population of jassids (nymphs & adults) and white flies (adults) can be estimated by the visual count technique during early hours of the day from requisite plants per
replication (usually counting from 1/5th of total plant population per plot), selected at random and tagged. The top, middle and bottom parts of the tagged plants should be
given due consideration. Alternatively, the sudden trap method using a cubical iron-
frame trap of 45cm x 45cm base and 60cm height clothed in high density polythene
can be used to trap the adult jassids and whiteflies for easy counting. The nymphs can
be counted adopting the visual/sight-count technique from the plants by gently
turning the leaves. Similarly, for aphids, the nymphs and adults can be counted on
the plants directly taking observations from at least a 10cm top shoot/twig for
sampling. Yellow pan-traps or sticky traps can also be used for counting the jassids
and whiteflies.
Insect Pests of Green Gram Vigna radiata (L.) Wilczek and Their Management
203
The population of jassds and whiteflies can be estimated by the sudden trap method using a cubical iron-frame trap of 45cm x 45cm base and 60cm height clothed in high density
polythene or covered by muslin cloth on three sides, while one side and the top can be
clothed with high density polythene for viewing the adults captured in the trap. This is
possible when the crop is 35 to 40 day-old; thereafter, we have to rely on visual count
technique as it is not feasible to use the sudden trap because as per agronomical practices the spacing is recommended as 30cm between the rows and 10cm between two pants in a
row; though, we may go for a spacing of 45cm (row to row) by 15cm (plant to plant in a
row). Yes, an aspirator should be used to suck the adults for a reliable count. The few adults that might escape while counting from each tagged plant or replicate is a common error and will be taken care of if the sample size is more. The jassid nymphs move sideways but do
not leave the foliage while observing, hence their count is reliable.
Data from visual counts can be homogenized by following the square root transformation
method, especially when zero counts are recorded. We add 0.5 or 1.0 to the visual count
data and find the square root before analysis that has to be retransformed after analysis for interpretation. In case of percentage data, if the percentage values range between 30 and 80, usually arc sine (angular) transformation would not be required; however, if the percentage values happen to be less than 30 and/ or more than 80, then angular transformation is
required before analysis of data.
Green gram being an indeterminate plant, vegetative growth and flowering go together
when the plant is 35 to 40 days of age; hence, using a suction trap (battery operated/electric) might not be successful, as it will cause more harm to the plant and at the same time disturb the insects. We can use the suction trap if the field/plot size is large so that sampling can be taken from distant areas within the field being observed without disturbing the insect
species on adjacent plants.
ii. The associated natural enemies like syrphid flies, coccinellids and others, can be
recorded by the visual/sight count technique from the same number of plants per
replication (1/5th of total population) randomly tagged, during early hours of the
day. Observations can be taken to study the predator-prey function under caged
conditions.
iii. Observations can be taken on a weekly basis or a 10-day basis and the prevailing abiotic conditions of the atmosphere can also be recorded accordingly to work out the
correlation coefficients between the populations and the abiotic factors of the
environment.
It is true that correlations do not establish the cause and effect relationships and must be interpreted with caution. Therefore, further working out the simple regression lines or linear regressions through regression equations enables us to know the effect of the abiotic factors (independent variable) on the population (dependent variable). Data so collected and
collated over many years (at least for 5 years in succession) will give a good understanding of the population trend.
The equation of a line of regression (Y on X) is given as:
Y = a + bX
204
Agricultural Science
The data can be entered and processed in “MS-Excel” using the correlation function and
make a chart in excel using the custom type Classic Combination Chart (either line-column on two axes or lines on two axes) that also enables to have the regression equation and
coefficient of determination (R2).
iv. Estimation of the population density of insect pests and their natural enemies in the different treatments can be made and expressed as a percentage after comparing the
data from the control treatment or the standard check. Wherever applicable, diversity
indices can be computed using suitable techniques (Shanon-Weiner or Simpson
Diversity Index).
The following mathematical/ statistical analysis can be made towards estimating the species richness and diversity:
Mean density:
Xi
Mean density
100
N
Where,
Xi
= No. of insects or natural enemies in ith sample
N
= Total number of plants sampled.
Shannon-Weiner diversity index (H’):
Shannon-Weiner diversity index
H’
p i
ln
pi
Where, p i = the decimal fraction of individuals belonging to ith species.
However, along with the Shanon Diversity Index the Simpson’s Index can also be
computed.
Simpson’s index is calculated using the equation:
N(N- 1)
Ds=
n(n- 1)
N= Total number of individuals of all species
n= Number of individuals of a species
v. To record the incidence of blister beetles at flowering stage the numbers of beetles per plant for a fixed time interval during the morning hours (8 to 10am) or evening hours (3
to 5pm) of the day can be observed on the randomly tagged plants. However, some
species visit during early hours while others late; hence, a preliminary observation on
their behaviour shall become essential before standardizing the methodology for blister
beetle counts.
vi. To note the damage of pod borers, the numbers of healthy and damaged pods can be
counted from a known (pre-decided) sample of pods (say 100) taken from the tagged
plants and the data expressed as a percentage of the total. Usually the pods are split
open to record the species of the borer under study.
Insect Pests of Green Gram Vigna radiata (L.) Wilczek and Their Management
205
vii. For the estimation of the population of soil dwelling predators, especially carabids, pitfall traps (500ml capacity glass jars) should be laid out in each replication and at least 3 traps should be randomly placed in each plot of 18 sq. m. (6m X 3m as length X
breadth). For instant killing of the predatory insects and to avoid cannibalism (as in
carabid grubs), ethylene glycol or formalin (1-2%) can be used in the traps.
Comparisons among the treatments can be accounted for.
2.2 Loss estimation and establishment of economic threshold for the pod borer
In order to asses the losses caused by insect pests of green gram the paired plot experiment, as suggested by Leclerg (1971), can be adopted. The method involves growing the crop in 26
plots, each measuring preferably 6m X 3m. Each plot should be separated by a buffer strip of one meter all around. One set of plots has to be kept protected from insect infestation by regular need-based application of recommended insecticides. The other set of plots has to be exposed to natural infestation and thus called unprotected. Observations on the plant
height, number of primary branches, pod length, pod and grain damage (%), and any other
yield attributing parameter recorded from five randomly selected plants from each plot at maturity should be taken. Loss in yield can be calculated by comparing the yield obtained from protected and unprotected plots using the following formula:
X1 -X2
Loss in yield(%)=
×100
X1
Where
X1 = Yield in treated plot
X2 = Yield in untreated plot
The yield data can be analyzed statistically and significance tested using the "t" test.
Sum of squareof thedeviation from themeandifference
Standarddeviations (s)=
Number of paired plots-1
Standarddeviation(s)
Standarderrorof meandifference(Sd)=
Numberof pairedplots(n)
1
Y - 2
Y
t=
sd
Where
Y1 = Average yield in treated plot; Y2 = Average yield in untreated plot
sd = Standard error of mean difference
2.3 Determination of economic threshold level for the lycaenid pod borer
In order to calculate the economic injury level for the pod borer, losses in grain weight due to various levels of larval density of the pod borer has to be estimated. Green gram can be sown in pots of suitable size and the neonate larvae can be released on the developing
206
Agricultural Science
tender pods or flowers at different population densities (1, 2, 3 and 4 larvae per plant or in a geometrical progression as 2, 4, 8 and 16). A no-larval release control should also be taken side by side on the pot plants. The plants should be caged properly and the treatments
replicated. Observations on the number of healthy and damaged pods, and grain weight per
plant should be recorded. Taking the reduction in yield due to different levels of larval density release, the regression analysis can be worked out to quantify the damage. The
economic injury level for the pod borer on green gram can be determined by using the
method suggested by Hammond and Pedigo (1982).
ManagementCost(Rs/ha)
Gain threshold(G.T.)=
=kg/ha
Marketed valueof Mungbean(Rs/kg)
Gain threshold(kg/ha)
Economicinjurylevel(EIL)
=insect/ha
Lossperinsect(kg/insect)
The economic threshold level can be calculated by the method suggested by Johnston and
Bishop (1987). They established economic threshold level as the population of economic
injury level minus the increase in population of the pest concerned per day. The increasing rate of larval population under natural field conditions can be determined by recording the weekly population of the pod borer during larval activity. The rate of increase in population can be calculated arithmetically.
2.4 Farmscaping in green gram with annual marigold and niger
Early flowering marigold variety must be sown in well prepared, raised nursery beds at
least 45 days before transplanting. Niger crop has to be directly sown 28 to 30 days before sowing the main crop of green gram. In short, sowing should be adjusted in such a manner
that flowering of niger/marigold and green gram should coincide so that nectar/pollen
feeding natural enemies would be attracted to the farmscape plants. The sowing operations for green gram and the different farmscape plants should be as:
1. In the green gram and niger farmscaping (3: 1 ratio), niger sowing is done first and
followed by sowing of green gram a month later.
2. In the green gram and marigold farmscaping (3: 1 ratio), transplanting of marigold on ridges should be carried out 45 days after sowing green gram.
The row to row distance and plant to plant spacing for green gram can be 60cm and 10cm,
respectively or 45cm and 10cm, respectively; whereas, mature seedlings of marigold are to be transplanted in between two rows of green gram at a distance of 30cm.
3. Pest management strategies
3.1 The pest insects
An estimated 200 insect pests that belong to 48 families in Coleoptera, Diptera, Hemiptera, Hymenoptera, Isoptera, Lepidoptera, Orthoptera, Thysanoptera, and 7 mites of the order
Acarina are known to infest green gram and black gram. Under severe cases stem fly may
alone cause more than 90 per cent damage with a yield loss of 20 per cent (Talekar, 1990).
The galerucid beetle, Madurasia obscurella causes damage up to 20 – 60 per cent. Whitefly, a
Insect Pests of Green Gram Vigna radiata (L.) Wilczek and Their Management
207
potential vector of mungbean yellow mosaic virus (MYMV), can cause losses ranging from
30–70 per cent. The major insect pests, particularly those often cited, have been enlisted in Table - 1.
The insect pests that infest green gram are better classified according to their appearance based on crop phenology. Accordingly, they can be: (1) stem feeders, (2) foliage feeders, (3) pod feeders, and (4) pests of stored grains; which are also convenient to access their
economic importance so as to devise suitable management measures.
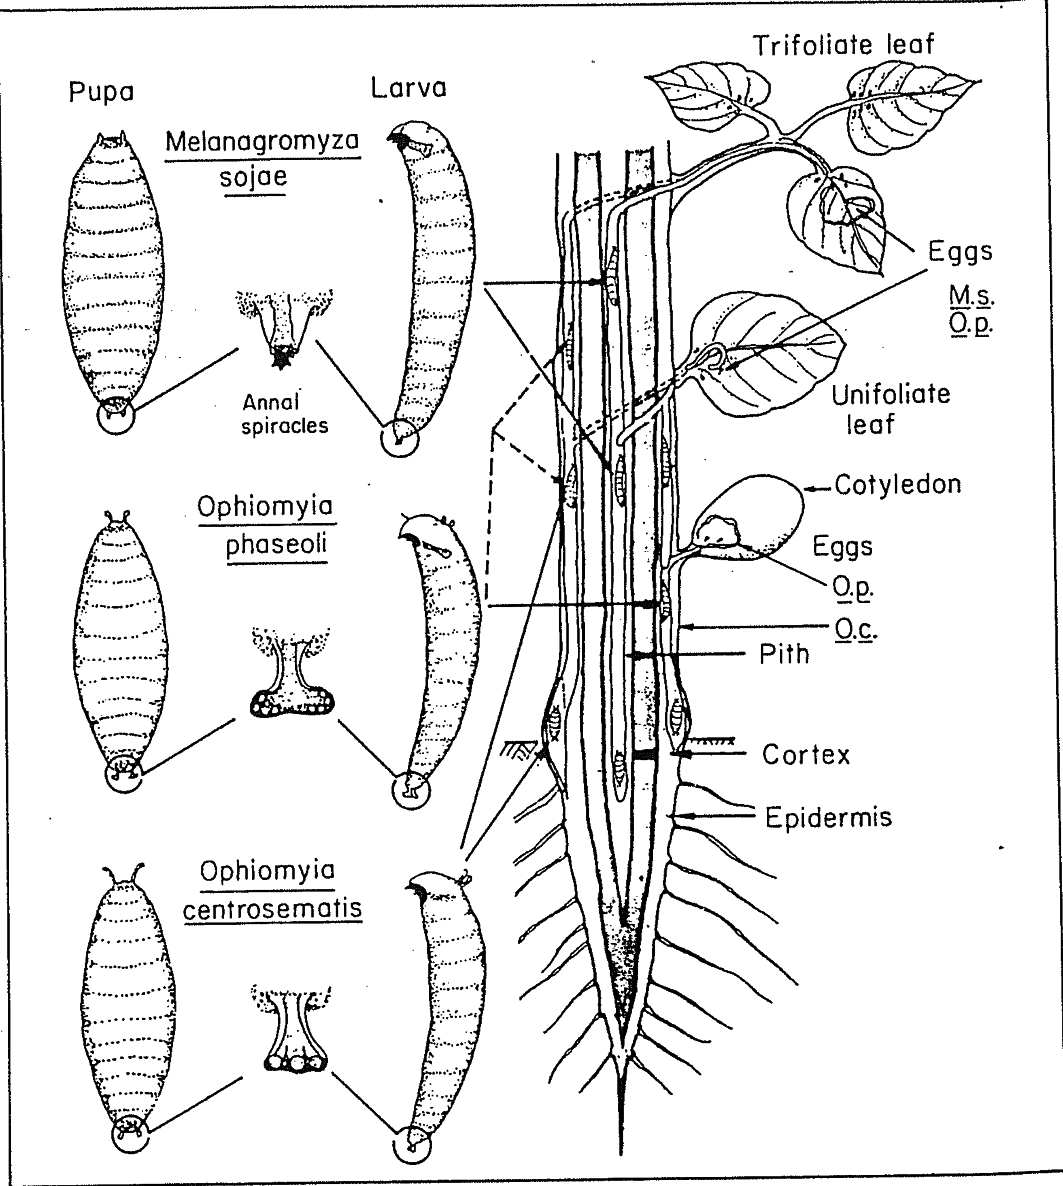
At the seedling stage are the agromyzid flies, also known as bean flies (possibly few
species), Melanagromyza ( Ophiomyia) phaseoli (Tryon) being of more common occurrence.
Ophiomyia phaseoli larva is a cortex feeder and pupates in the cortex mostly at the root-shoot junction. Sometimes pupae can be seen sticking under the membranous epidermis. In India
the girdle beetle, Oberiopsis brevis (Swedenbord), a major pest of soybean, sometimes infests mungbean locally (Talekar, 1990).
( M. s. = M. sojae, O. p. = O. phaseoli, 0. c. = O. centrosematis; please note, O. phaseoli does not lay eggs in the cotyledons of green gram) [Ref.: Talekar, 1990]
Fig. 1. Location of ovipositional and larval feeding sites in soybean plant
208
Agricultural Science
The foliage feeders, especially defoliators that belong to Lepidoptera and Coleoptera
include: the leaf folder, Lamprosema indica (F.); caterpillars of Spodoptera exigua (Hubner), Anticarsia irrorata (F.) the tobacco caterpillar, Spodoptera litura (F.), the hornworms, Agris convolvuli (L.) and Acherontia styx (Westwood); the Bihar hairy caterpillar, Spilosoma obliqua (Walker), the tussock caterpillars, Euproctis fraterna (Moore), Dasychira mendosa; the weevils, Cyrtozemia dispar Pascoe, Myllocerus undecimpustulatus maculosus Desbr., Myllocerus discolor Boheman, Myllocerus viridanus Boheman, Episomus lacerata Fabr.; the hada beetle, Henosepilachna spp., chrysomelid (leaf) beetles, Monolepta signata, and the grasshopper, Attractomorpha crenulata crenulata.
Among the sap feeding insects the more common are aphids, especially black bean aphids,
Aphis craccivora Koch; jassids, Empoasca kerri Pruthi; white flies, Bemisia tabaci Gennadius, thrips belonging to genus Megalurothrips and Caliothrips indicus Bagnall; the plant bugs, Riptortus spp., Nezara viridula L., Plautia fimbriata (Fabricius) and the pod bug, Clavigralla spp. They cause significant damage to green gram foliage and pods; besides causing
damage to other related legumes. It was observed that green gram cultivated in the vicinity of pigeon pea was heavily infested and rather preferred by the pigeon pea pod bug,
Clavigralla spp. (Swaminathan, et al., 2007). A linear relationship was observed between pod feeder infestation and seed loss, with the rate of seed loss being greater for Riptortus linearis and Nezara viridula than for Maruca testulalis (Hussain and Saharia, 1994).
The blister beetles (species of Mylabris) cause serious damage to the flowers, especially to the second and third flush during August – September months in most green gram cultivation
areas in India.
The key pod borers include the lepidopteran caterpillars – the spotted pod borer, Maruca testulalis (Geyer) [ Maruca vitrata] and the spiny pod borer, Etiella zinckenella Tretsche; however, the blue butterflies, Lampides boeticus Linnaeus and Catechrysops cnejus Fabricius; the gram caterpillar, Helicoverpa armigera (Hubner) have also been reported among the major pests.
The primary insect pests of stored green gram include species of bruchids belonging to the genus Callosobruchus. The annual yield loss is estimated to be 20 per cent in pigeonpea, 15
per cent in chickpea and 30 per cent in black gram and green gram. On an average 2.5 to 3.0
million tonnes of pulses are lost annually due to pests (Ali, 1998). Damage due to bruchids, Callosobruchus chinensis (L.) begins right from the field; adults emerging from the stored seeds lay eggs on healthy grains. The field infestation ranges from 7.8–9.9 per cent (Banto and Sanchez, 1972) and 100 per cent destruction of seeds occurred at 9.9 per cent field
infestation.
3.2 Pest management strategies
3.2.1 Organic approach
Of late, use of various cultural practices and framscaping for the management of insect pests of green gram seems to gain importance. Adjusting the sowing dates, use of resistant
varieties and growing inter or trap crops can be followed depending on the availability and effectiveness in a particular location. Since use of bio-control agents has not been successful in these crops although it is a viable alternative despite the record of several natural enemies in the field, their augmentation through farmscaping is a viable option.
Insect Pests of Green Gram Vigna radiata (L.) Wilczek and Their Management
209
Farmscaping is an ecological approach to pest management; comprising the use of
hedgerows, insectary plants, cover crops, and water reservoirs to attract and support
populations of beneficial organisms such as insects, bats, and birds of prey. Such mini-
livestock requires adequate supplies of nectar, pollen, and herbivorous insects and mites as food to sustain and increase their populations. The best source of these foods is flowering plants. Flowering plants are particularly important to adults of the wasp and fly families, which require nectar and pollen sources in order to reproduce the immature larval stages
that parasitize or prey on insect pests. However, using a random selection of flowering plants to increase the biodiversity of a farm may favor pest populations over beneficial organisms.
It is important to identify those plants, planting situations, and management practices that best support populations of beneficial organisms.
There are many approaches to farmscaping: some farmers, after observing a cover crop
harboring beneficial insects, plant strips of it in or around their crop fields. The advantages of this kind of approach are that it is simple to implement, is often very effective and the farmer can modify the system after observing the results. Problems arise when the beneficial insect habitat, without the knowledge of the cultivator, also harbors pest species. In other instances the beneficials may not exist in numbers sufficient to control pest populations, especially during the time when pest populations generally increase. Predator/prey population balances are influenced by the timing of availability of nectar, pollen and alternate prey/hosts for the beneficials; therefore, essentially efforts must be made to for have year-round beneficial organism habitat and food sources. The beneficial habitat season may be
extended by adding plants that bloom sequentially throughout the growing season or the
whole year (Rex Dufor, 2000).
The mechanisms by which insectary plantings can help natural enemies of crop pests and
other beneficial arthropods are complex, and their effectiveness can vary greatly from site to site depending on the specific situation. For this reason, it is especially important that insectary plantings are planned and assessed on a case-by-case basis, and integrated into whole-farm plans for pest management and other farm operations. Insectary plantings that
are well thought out can maximize the benefits to natural enemies and minimize the benefits to pest species (Pfiffner and Wyss 2004, Quarles and Grossman 2002).
The goal of farmscaping is to prevent pest populations from becoming economically
damaging. This is accomplished primarily by providing habitat to beneficial organisms
that increase ecological pressures against pest populations. Farmscaping requires a
greater investment in knowledge, observation, and management skill than conventional
pest management tactics, while returning multiple benefits to a farm’s ecology and
economy. However, farmscaping alone may not provide adequate pest control. It is
important to monitor pest and beneficial populations so that quick action can be taken if beneficials are not able to keep pest populations in check. Measures such as maintaining
healthy soils and rotating crops are complementary to farmscaping and should be
integrated with farmscaping efforts. Bio-intensive Integrated Pest Management (IPM)
measures, such as the release of commercially-reared beneficials (applied biological
control) and the application of soft pesticides (soaps, oils, botanicals) can be used to
augment farmscaping efforts.
210
Agricultural Science
In a case study on the impact of farmscaping in greengram on the major insect pests and
their natural enemy complex at the College farm, Udaipur, India, a comparison of the
seasonal mean abundance of the major foliage feeding and pod damaging insect pests
showed a significant difference among the treatments. The Shanon Weiner diversity index
was the maximum under green gram + marigold weeded and unweeded farmscape
conditions being 0.7936 and 0.7790. The sole crop of green gram had the lowest diversity
index of 0.6622 for weeded and 0.6863 for unweeded conditions. Comparisons made for
the associated natural enemy complex in the different treatments showed that the
farmscape treatment green gram + niger under unweeded conditions had the highest
Shanon Weiner diversity index of 1.5932 followed by that for green gram + marigold
under unweeded conditions with an index of 1.5716. Green gram sole crop had the lowest
diversity indices being 1.2882 and 1.3854 under weeded and unweeded conditions,
respectively. Niger, by virtue of being taller than green gram, acts as a physical barrier to blister beetle infestation on green gram floral parts. Some blister beetles may happen to alight on niger flowers and cause some damage, thereby safeguarding damage to green
gram. Marigold is preferred by Helicoverpa armigera (Hubner) for laying eggs; thereby, the main crop of mung bean/green gram significantly escapes the pest infestation
(Unpublished data – Swaminathan, 2011).
3.3 Cultural practices
Different cultural practices have been advocated from time to time; however, these
traditional practices and those improved happen to vary from place to place and have
responded in a varied manner. Intercropping green gram with cereals/millets (maize, sorghum and pearl millet) is often in vogue. Green gram is sown by keeping the row to row spacing at 30 cm and plant to plant distance at 10 cm. In the inter-cropped system, green gram and maize (in 1: 1 ratio) are sown in alternate rows at a distance of 30cm apart. In spring planted sugarcane, 1 or 2 rows of green gram can be planted in between the
sugarcane rows. Intercropping of green gram can also be done in Mentha. Similarly, in the newly planted poplar crop and in horticultural plants or orchards (papaya, pomegranate)
intercropping green gram is a viable option.
Weed-free crop of green gram harboured lower populations of major insect pests, while
weedy crop was conducive to their population build-up. With respect to insect infestation, keeping the field weed-free throughout the crop period was equivalent to removal of weeds up to the vegetative-3 stage of the crop. The effectiveness of weeding however varied
according to the pest species (Rekha Das Dutta, 1997).
Showler and Greenberg (2003) observed that the presence of weeds in cotton was associated with greater populations of 9 of the 11 prey arthropod groups, and 9 of