Slopes > 10 °
Slopes > 10 °
“key biotopes”
Farmland
Farmland
Pasture land of
pointed out in a
pointed out in a
regional interest
preservation
preservation plan
plan
National
Biodiversity
interests of
areas, Bird
cultural
biotopes ref.
preservation
Nature 2000
Ancient remains
Nature
Coastal zone
National
park
reservation
preservation
areas
Excluded areas
Noise > 40
Noise > 30 dB(A)
Noise > 40 dB(A)
dB(A)
< 800 m
distance to
No artillery range
wind power
aggregates
Table 2. Criteria for assessment of the five characteristics, final version. Figures in brackets refer to the land cover nomenclature (http://www.eea.europa.eu/publications/COR0-landcover/page001.html).
The Agricultural Landscape for Recreation
229
In the present regional study, we have limited our investigation to the five characteristics Serene, Wild, Lush, Spacious and Culture, as the three characteristics the Common, the
Pleasure garden and Festive/centre require local data from the municipalities not available at the time of the study.
Also we have excluded the four largest cities in Skåne (Malmö, Lund, Helsingborg and
Kristianstad) but kept smaller towns and villages. In cities, large parks and other inner city green areas are a main recreational resource for residents. GIS data to elaborate
characteristics of these areas are not available on a regional level. Therefore, the present study is limited to the rural and semi-urban areas of Skåne.
3.4 Statistical analysis
This study included 24,819 respondents located using their residential coordinates. Using GIS, the presence/absence of each of the five characteristics within 300 m from each
respondent was defined based on the criteria in Table 2. The working process for the
assessment of the characteristics is described in Results below. Table 3 shows the percentage of the population living close (300 m or 100 m) to the different characteristics. Spearmanś rank correlation coefficient, appropriate for investigating associations between ordinal
scales, was used to test associations statistically between the number of characteristics (0-5) present within 300 m or 100 m of the respondent’s residence and ordered answers to the
survey questions. P-values below 0.05, and equivalently 95% confidence intervals for odds ratios excluding unity in ordinal regression analyses with adjustments for a broad list of individual determinants of health, were regarded as statistically significant (Björk et al.
2008).
Characteristics
% of population
within
< 300 m
< 100 m
Serene 6
4
Wild 3
1
Lush 24
7
Spacious 10
5
The common
(not in the study)
The pleasure garden
(not in the study)
Festive, centre
(not in the study)
Culture 24
15
Table 3. Percentage of the population that has the different characteristics within 300 and 100 meters, respectively, distance from their residence (Björk et al. 2008). Note that all individuals that have a certain characteristics within 100 meters also have it within 300
meters distance from their residence.
Each respondent’s coordinates are defined as the centre point of the complex in which
he/she lives. That centre point can be quite far from the position of the person’s home,
making the 100 m distance incorrect. 300 meters is a fairly normal distance to walk to get to a nature area or a park.
230
Agricultural Science
One outcome of the study is that the objectively GIS-assessed availability of the five
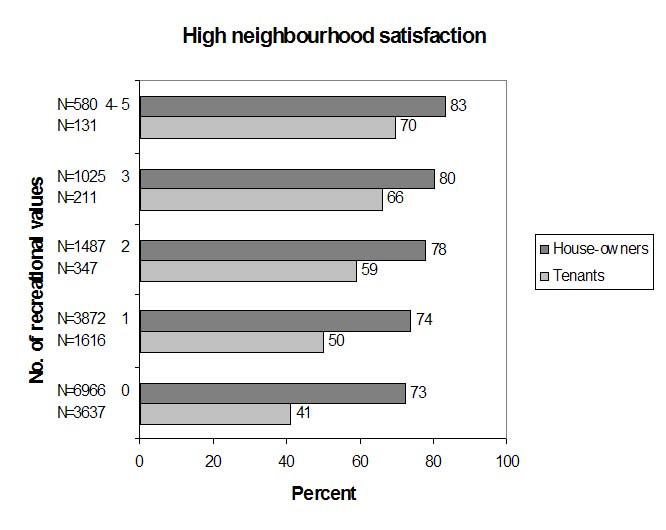
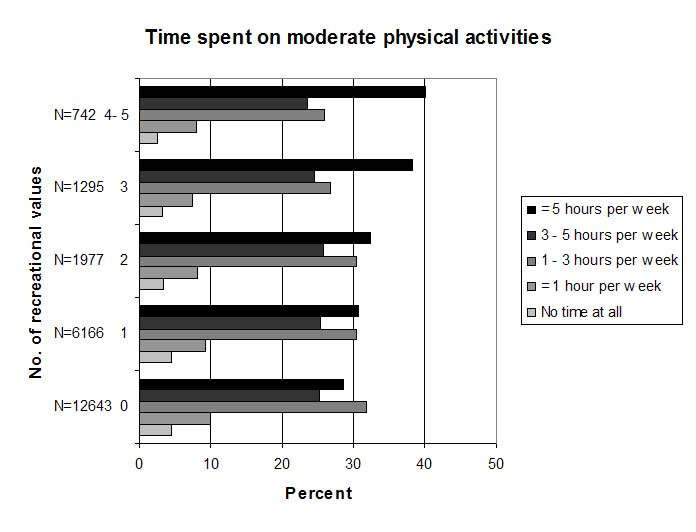
characteristics near one’s residence (< 300 m) is positively associated with neighbourhood satisfaction (Figure 1), moderate physical activity (Figure 2) and, among tenants, low BMI.
Thus, figure 2 suggests that individuals spend more time on average on moderately
demanding physical activities the more characteristics they have within 300 m from home.
This association remained after adjustment for individual (socioeconomic) factors.
The impact of the number of characteristics on BMI was less clear. After adjustment for
individual factors associated with BMI, the beneficial effect of the characteristics was present among tenants but not among house-owners. The proportion of obese (BMI > 30 kg/m2)
individuals among tenants was 17% in residences with zero characteristics within 300
metres compared with 13% in residences with at least one characteristics present (Björk et al 2008). No clear association between the number of characteristics and self-rated general
health was detected after adjustment for individual factors.
The result for neighbourhood satisfaction among people living in flats is remarkable. If all five characteristics exist within 300 m, 70% of the tenants are satisfied with their
neighbourhood, whereas a maximum of 50% are satisfied if only one or no characteristics
are present. The corresponding figures for house owners are 83 % and 74 %. Consequently,
house owners seem to be rather satisfied with having their own garden, while tenants’ wellbeing is highly dependent on having good natural environments or parks within 300 m from
home. This provides important input to the current debate on global warming and
densification in urban planning. We are supposed to live more densely in cities to minimize commuting to our workplaces, but on the other hand, if we do not have sufficient nature
and park qualities close to our homes in the cities, we will need to commute into the rural landscape for recreation, and that also has an impact on the climate effect.
Fig. 1. The relation between the number of recreational values (0–5) of the natural
environment within 300 metres distance from the residence and the percentage reporting
high neighbourhood satisfaction among house-owners (N = 13,930 answers) and tenants (N
= 5,942 answers) (from Björk et al.2008).
The Agricultural Landscape for Recreation
231
Fig. 2. Time spent on moderate physical activities in relation to the number of recreational values (0–5) of the natural environment within 300 metres distance from the residence (from Björk et al. 2008).
3.5 Results – Working process for the assessment of characteristics
The choice of criteria for elaborating each characteristic using GIS was in some cases a long process in which different combinations of classes of parameters for accessing each
characteristic were elaborated successively. These trials generally started with a discussion among the research group members to develop a first set of criteria for identification. The first attempt at classification aimed at achieving an appropriate number of areas for the concerned characteristic, not too many and not too few.
As seen in Table 3, the scope of characteristics close to respondents on average differs
substantially. Culture and Lush are most common. Wild and serene are most rare.
232
Agricultural Science
The resulting maps were examined by the project staff and compared to their own
experiences of certain areas in the studied region. After critical studies of the resulting maps, other classification criteria were tested in a second attempt, and so on in further attempts until the final classification versions were established – those found in Table 2. At the end of the paper, you can see the five maps of the final classification.
3.5.1 Serene
The effort to develop the classification model can be illustrated to some extent by looking at the work with the characteristic Serene. For Serene, we first used a minimum size criterion: Areas should have a minimum size of 20 hectares to be classified as Serene. The reason for this was that an area must be relatively large to be perceived as Serene. From the beginning, we also claimed that the average noise level should not exceed 40 dB(A)24 h, and that a 250 m buffer along roads and dwellings was required. Moreover, we required a buffer of 800 m
around large wind power generators and shooting ranges.
Later on, the area size criterion for Serene proved to be useless, as a single large forest often consists of several serene land use areas grouped together, each of which is smaller than 20
hectares. Therefore we rejected that size criterion. We also rejected the minimum distance criterion to roads and wind power generators. The noise criterion, however, was sharpened to 30 dB(A)24h. This is perhaps the reason for the relatively rare presence (Table 3) of Serene near the residents.
3.5.2 Wild
Forests, thickets, bare rock, mires and wetlands, lakes and rivers – all larger than 15 ha, if not closer than 1 kilometre from villages and towns. If closer, there is no minimum size for the area, because children seem to sense the Wild characteristic even in very small areas.
Also areas steeper than 10° are classified as Wild.
Excluded are areas with a noise level over 40 dB(A), and areas with wind generators within 800 m.
In our first attempts, we set the minimum size of areas to 30 ha and to 5 ha within 1 km from villages and towns. But that reduced the amount of Wild too drastically.
3.5.3 Lush
Mixed forest, marshes and mires, beaches, dunes, sand plains and bear rock. Plus all
registered “key biotopes”, certain inventories of pasture land, biodiversity areas, bird
biotopes of regional interest, also Nature 2000 objects and national parks.
Many of the mixed forests are very small areas, down to 25 x 25 m integrated in the open
agricultural landscape, and these are of great importance to biodiversity from an
ecological as well as recreational point of view. At our first attempt we included a buffer zone of 100 m. The reason was that fringe zones between different biotopes are very
species rich, and we wanted to capture that by including a buffer zone in the biotope area concerned. However, this resulted in areas that were far too large to make the
classification useful. One hundred meters is an overestimate of specious rich fringe zones, they are narrower than this.
The Agricultural Landscape for Recreation
233
The best areas cannot be drowned in an overly generous classification, which is a general problem in most landscape analysis. Therefore, this buffer zone was rejected from our
classification. Despite this rejection, Lush was classified close to a large percentage of the population.
3.5.4 Space
Beaches, dunes, and sand plains, bare rock, sparsely vegetated areas, burnt areas, natural grassland, moors and heath land, all forests larger than 25 ha. Plus slopes more than 10
degrees (creating viewpoints), farmland pointed out in a preservation plan and coastal zone preservation in a national plan.
Excluded are areas with a noise level over 40 dB(A).
In our first attempt, we used minimum size criteria: Forest 100 ha; natural grassland 20
ha; heath 50 ha. This resulted in very few areas. One observation was that many open
space areas are small, but together form large open spaces. Therefore the size criteria for grassland and heath were rejected in our classification. Moreover, forests of different
categories are in reality rather small, but together form large forest areas, giving the
impression of “entering another world”. To address this, we reduced the size criterion for forest to 25 ha.
In our first attempt, we also used noise level criteria for roads 250 m from the residence, but rejected these as being too high in many cases. At first we also used 800 m minimum
distance to wind power aggregates as a criterion for obstructing a feeling restfulness, but later rejected this as well.
3.5.5 Culture
Non-urban parks, farmland pointed out in a preservation plan, areas of national interest in cultural preservation, nature reservation areas.
In our first attempt, we also included national interests in recreation. Such areas often overlap national interests in cultural preservation, and are in these cases included anyway.
However, they also include large areas for recreation without meeting criteria for the
Culture characteristic, but instead for some of the other characteristics, so that dataset was rejected from Culture. Culture was classified as being close to a relatively large percentage of the population (see Table 3).
4. Discussion
When conducting a regional analysis of environmental perception, there are a great many
pitfalls to consider. Regional studies require existing datasets mainly produced to show
objective data, but perception is a subjective interpretation of the real environment. Peopleś perceptions also differ from individual to individual due to their previous experiences. This, however, is a general issue independent of the scale of the study. For these kinds of studies, the elaboration of classification criteria always has to be done by representatives of the local community.
234
Agricultural Science
The present epidemiological study aimed at finding general associations between well-being and proximity to nature for the population in Skåne. Epidemiological studies provide
overall patterns of associations and variations. These kinds of studies do not necessarily give a “correct” picture of individual cases.
One pitfall of using objective data such as forest types, topography, etc., is the issue of interpreting and combining the data so they correspond to common perceptions of nature
characteristics. That is what the present paper tries to describe. It is the first study of its kind, and there is a great deal more research to be done to improve the methods. One issue, for example, is that Corine land cover data are derived from an analysis of satellite data, and this is associated with a relatively large percentage of misinterpretation, for some land use types around 30% (Rost & Ahlcrona, 2005).
Because the book focuses on agriculture, we would like to comment additionally on the
agricultural landscape. Skåne is in the southwestern half of the region dominated by
agriculture. The soil is fertile. Avenues and other landscape elements are impressive. A
rather flat zone 30 kilometres wide and following the southern and western coast is the
most productive part (the Baltic moraine clay), and is at the same time the most urbanized area, with many roads and railroads creating noise. To some extent this zone is spacious
and includes long views, but it is not particularly accessible for walking, and walking
promotes a feeling of restfulness. More accessible is the diagonal zone of Skåne from
southeast to northwest. This zone has more hills and small scale farmland and is more
accessible and silent, offering a restful feeling of “entering another world”, a coherent whole. Both zones are rich in impressive visible cultural history, as can be seen in the last map.
There is a need for validation of this kind of analysis. High correlations between the
prevalence of GIS-evaluated characteristics and people’s responses concerning health and
well-being indicate that development of parameters for GIS evaluation is on the right path.
Overall, we found a high correlation between peopleś perception of a cosy atmosphere and
the prevalence of the characteristics. The Skåne study shows that the rural landscape, both arable land and forests, plays an important role in health promotion.
The Swedish National Institute of Public Health now recommends these characteristics as
a checklist for green planning (FHI, 2009). The eight characteristics have been
implemented in a number of planning projects for housing and infrastructure in Sweden
(Skärbäck, 2007).
5. Conclusion
In the study by Björk et al. (2008) green characteristics of the nearby natural environment was shown to be positively associated with neighbourhood satisfaction and physical
activity. The association with neighbourhood satisfaction was especially marked among
tenants, and a beneficial effect on BMI was also noted in this group. No evident effect of the green characteristics on self-rated health was detectable. The cross-sectional design limits definite conclusions regarding cause-effects. A further limitation is that the study was
restricted to rural and semi-urban areas and the generalizability of the results to inner-city areas is therefore uncertain.


The Agricultural Landscape for Recreation
235
Map 1. Serene. The western part of Skåne Region consists mainly of arable land and cities.
Silent (<30 dB(A) nature areas accessible for recreation are rare in that urbanized area. The eastern part has much more assessable nature land, however partly penetrated by road
noise, which reduces the serenity.


236
Agricultural Science
Map 2. Wild. The criteria for silence (<40 dB(A)) is not as heavy as for Serene. Some open land use categories from Serene are left out here.


The Agricultural Landscape for Recreation
237
Map 3. Lush, rich in species. Small parts of nature. And some large nature reservation areas.
No reduction of noise.


238
Agricultural Science
Map 4. Space. Mainly open and half open accessible land, e.g. classified in a national plan for preservation of farmland.


