101
and a rotor without any settled particles that may interact with the flow pattern. In fact, the length L is reduced by up to 30 % due to the effects of the inlet. With increasing fill level, the sediment interacts with the flow pattern and reduces the free length L so that the cut size of the centrifuge increases (Spelter et al., 2010). Therefore the sediment build-up has to be
included in the calculation of the separation efficiency and the determination of the flow
pattern for tubular centrifuges.
2.1 Flow pattern
There are two limiting cases for the flow pattern in solid bowl centrifuges. Either the entire volume is passed by the feed or the main axial fluid flow takes place in a thin layer on top of a stagnant but rotating pool. The two different flow patterns are schematically shown in
Figure 2. When a boundary layer flow is present, the geometric constant rbowl in Equation 1
has to be replaced by the radius where the stagnant pool begins (rboundary layer).
When starting building centrifuges and evaluating the separation performance, it was
assumed that the proportion of the volume in which significant axial fluid velocities occur, further referred to as active volume Vac or area Aac, is nearly as high as the entire volume of the centrifuge, Vac=100 % (Horanyi & Nemeth, 1971). Other researchers realised that the
active volume of the centrifuge is significantly smaller than the capacity of the centrifuge (Vac<<100 %) and developed the boundary layer theory (Bass, 1959). Today, most
researchers who work with solid bowl centrifuges support the boundary layer theory.
Fig. 2. Flow pattern in solid bowl centrifuges
Recent studies by the authors have confirmed the validity of this theory for industrial solid bowl and tubular bowl centrifuges (Romani Fernandez & Nirschl, 2009; Spelter & Nirschl, 2010; Spelter et al., 2010). Nevertheless it is important to pay attention to the acceleration geometry of the centrifuge and the influence of the settled particles on the flow pattern. In many centrifuges, the feed enters the rotor via a cone or a jet hitting a distributor plate. The


102
Applied Computational Fluid Dynamics
liquid is not accelerated to the tangential velocity of the pool surface and thus hits the
surface with a certain velocity gradient. The rotating pool accelerates the incoming liquid to the angular velocity. The pressure gradient in the rotating liquid stabilises the flow pattern and reduces the mixing of the feed and the rotating pool in radial direction. Thus a
stratification of the liquid in radial layers occurs from the inlet and the liquid flows axially at the liquid-gas interface in a boundary layer. The flow is eased by the reduced friction at the interface between liquid and gas. The flow pattern will be different if the liquid is not fed to the pool surface or if intensive mixing occurs at the inlet. This is the case for some tubular centrifuges, as long as no sediment is present. Figure 3 a) shows the inlet geometry of a tubular bowl centrifuge as it was used in previous studies. The metal structure accelerates
the incoming liquid to a certain rotational speed and significant mixing of incoming and
rotating liquid occurs. The rigid body rotation is reached after a few centimetres behind the inlet. Figure 3 b) shows the acceleration geometry after 5 minutes of centrifugation. The
settled yeast cells block a significant section of the inlet geometry and thus impede intensive mixing and acceleration. This has been observed for various minerals and biological
products (Stahl et al., 2008) and is detectable by measuring the residence time and
separation efficiency in the centrifuge at different fill levels. The growth of the sediment will change the flow pattern significantly if it reaches the active area. This may not be the case for industrial scale solid bowl centrifuges but has to be included in the calculations of the separation efficiency in tubular bowl centrifuges.
Fig. 3. Inlet geometry of tubular bowl centrifuge – a) empty rotor; b) with sediment after 5
min of centrifugation at 15000 rpm; c) as “b” but at 40000 rpm
2.2 Rotor geometry
Other inlet systems have been analysed in a recent research project (Spelter, et al. 2011). The liquid is accelerated by rotating inlet pipes and the outlet of these pipes is below the pool surface. This minimises the lag of the tangential velocity of the incoming liquid significantly and the trapping of air in the fluid. This feeding system may be used in existing centrifuges in order to enhance the separation efficiency by reducing the axial section where the
tangential velocity gradient reduces the effective centrifugal force on the settling particles.
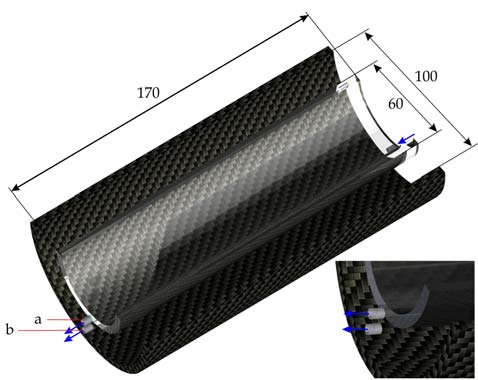
Figure 4 shows a simplified scheme of the rotor of the test rig. The test rig is operated with two different rotor setups. Either the centrifuge runs using both cylinders, further referred to as tandem setup, or without the inner glass cylinder, further referred to as overflow
setup. The tandem setup is similar to the one applied in high-performance centrifuges used
for the production of vaccines. In these centrifuges, the outer rotor is often made of titanium and the inner one of plastic, e.g. Noryl®. The liquid enters the cylinder halfway between
Computational Fluid Dynamics (CFD) and
Discrete Element Method (DEM) Applied to Centrifuges
103
inner and outer cylinder at a radius of 42 mm at the top. The inlet is marked with an arrow
and the height of the inlet is further referred to as H=0 mm. Both cylinders and the feed
pipes rotate with the same revolutions per minute. There is no air in the system as the void is entirely filled with water. The liquid leaves the centrifuge at two outlet bores at a radius of 36 mm. In the overflow setup, only the outer cylinder is used and thus an air core is present.
The liquid leaves the centrifuge via the two outlet bores at 36 mm and via two additional
outlet bores at a radius of 30 mm, which adjust the minimum pool level. The two bores at
36 mm can be sealed. The height of the outlet is at H=170 mm, the overall length of the
cylinder is 200 mm.
Depending on the pressure drop at the outlet bores, the water level rises above the radius of the weir. The superelevation is the equilibrium of pressure drop, rotational speed and
throughput. With higher rotational speed and lower throughput the elevation is close to
zero. With increasing throughput and lower rotational speeds, the centrifuge can be entirely filled. In the test rig, the maximum elevation is limited by a bore (radius 12.5 mm) that is necessary for the measurement of the flow pattern with Laser Doppler Anemometry
(Spelter, et al. 2011). Once this radius is reached by the liquid, it overflows the circular weir without hindrance.
Fig. 4. Simplified scheme of the setups of the centrifuge test rig - outer rotor made of carbon fibre reinforced plastic, inner one made of tempered glass - a) additional outlet for overflow setup; b) outlet for tandem setup
3. Mathematical formulation of the fluid
To describe the flow pattern, it is necessary to determine the velocity components in all of the spatial directions considered as well as the pressure and, in the case of compressible
flow, the density at any time and position in the domain. This chapter summarizes the
mathematical methodology used to calculate these parameters.
The conservation equations of the fluid mechanics, conservation of mass, momentum and
energy, can be obtained by means of a balance around an infinitesimally small fluid
element. The continuity equation, which is derived from the mass conservation, describes
104
Applied Computational Fluid Dynamics
the temporal change of mass in the volume element as the net rate of flow mass into the
element across its boundaries. In the case of the incompressible flow considered here, the
continuity equation simplifies to
v 0 . (2)
In an analogous way, the momentum equation can be determined based on the conservation
of momentum in all of the spatial directions considered. Newton’s second law states that the rate of change of momentum of a fluid element equals the sum of the forces acting on the
volume element. These forces can be surface forces, such as viscous forces and shear and
normal stresses, or mass forces, such as gravity and centrifugal forces. For incompressible
and Newtonian fluids in turbulent regime, the resulting momentum conservation equation
follows to be
v
v v p
2
v
(3)
t
F
t
,
where τt represents the tensor of turbulences and F other additional forces that can be
included expressed as volumetric forces. All terms from Equation (3), the Reynolds-
averaged Navier-Stokes equation (RANS), are discretized and calculated for each volume
cell with the exception of τt, which is modelled. The RANS equation together with the
continuity equation form an equation system of four differential equations with four
unknown variables, the flow velocities u, v, w in x, y and z direction, respectively and the pressure p, which can be numerically calculated. This equation will be used for simulation
of the centrifugal flow when only one phase is considered. For the cases where the liquid
pool rotates around an air core, a multiphase approach must be used in order to simulate
both, the air and the liquid. The presence of solid particles is ignored for flow simulation purposes, which is an acceptable assumption for low solid concentrations of the
suspensions, as is the case in the present study.
3.1 Two-phase approach
The Volume of Fluid method (VOF) (Hirt & Nichols, 1981) is an interface tracking method
that simulates the gas-liquid multiphase flow. This method is a simple and efficient
formulation designed to track the interface of two phases that do not interpenetrate with a
relatively small number of interfaces. Hence it is often used to simulate the gas-liquid
multiphase flow in industrial devices (Brennan, 2003; Brennan et al., 2007; Li et al., 1999; Mousavian & Najafi, 2009). VOF introduces a variable which takes values from zero to one and represents the volume fraction of one of the phases in each cell. A continuity
conservation equation is solved for each phase
(4)
q q
q qv 0
t
q
.
Furthermore the volume fraction of each phase q in any cell has to obey
n
q
1 . (5)
q1
Computational Fluid Dynamics (CFD) and
Discrete Element Method (DEM) Applied to Centrifuges
105
Using the VOF method, a single momentum equation, the Reynolds-averaged Navier-Stokes
equation, is solved throughout the domain, and the resulting velocity field is shared among
the phases. The dependency on the volume fraction is implemented by using volume-
averaged values for the density and viscosity , as explained in Equations 6 - 8.
v
v v p
2
v
(6)
t
F
t
n
q
q
(7)
q1
n
q
q
(8)
q1
3.2 Turbulence models
Due to high velocities and complex flow areas, most of the flow patterns of interest in
process engineering, aviation, and automotive engineering become unstable above certain
Reynolds numbers and, thus turbulences emerge. Turbulent eddies appear at very
different time and length scales and are always three-dimensional. The kinetic energy
stored in the rotational movement of the large eddies is passed to smaller eddies, until
they disappear by energy dissipation. A turbulent flow is characterized by a chaotic and
random fluctuation of the flow properties velocity and pressure. The conservation
equations are able to capture the physics of the fluctuation motion, but in order to solve
all the vortex structures of a turbulent flow, an extremely fine grid and very small time
steps would be necessary. The memory and the computing power required for the so-
called Direct Numerical Simulation (DNS) can only be provided by supercomputers. For
that reason, turbulence is usually modelled with different mathematical approaches. A
large-eddy simulation (LES) performs a filtering of the fluctuating flow quantities. The
small eddies have a common behaviour and are nearly isotropic, while large eddies are
more anisotropic and their behaviour is strongly influenced by the geometry of the
domain, the boundary conditions and the body forces. Thus larger eddies are directly
calculated, while fine structures are modelled. As a result, the computational demand
decreases regarding to the DNS but it is nonetheless high in comparison with the
approaches modelling all the turbulence scales.
The flow variables can be represented as the sum of a time-averaged size and an additional
fluctuation:
u u
'
u ;
v v
'
v ;
w w
'
w ;
p p
'
p . (9)
The substitution of these expressions in the momentum conservation equation for
incompressible flows and the subsequent temporal averaging yield to the Reynolds-
averaged conservation equations. In the modified continuity equation, the velocity
component is just replaced by the time-averaged variable. In the Reynolds-averaged Navier-
Stokes equation (RANS), the fluctuation velocities appear in an additional tensor, the
Reynolds stresses tensor τt:
106
Applied Computational Fluid Dynamics
'
u '
u
'
u '
v
'
u
'
w
t
'
v '
u
'
v '
v
'
v
'
w . (10)
'
w '
u
'
w '
v
'
w
'
w
The description of a turbulent flow with the RANS equation requires modelling of these
tensor terms. The most complex classical turbulence model is the Reynolds Stress Model,
RSM, (Launder et al., 1975), which uses transport equations to model each of the elements of the stress tensor and in addition an equation for the dissipation rate of the turbulences. This means that five additional transport equations are required in two-dimensional flows and
seven in three-dimensional flow. This way, the directional effects of the Reynolds stress field can be taken into account. This model is recommended for flows with complex strain fields,
such as highly swirling flows, or significant body forces. However, the computational cost of RSM is often unaffordable.
An effective method to reduce the modelling effort is to apply the Boussinesq approach,
Equation (11). This approach introduces the eddy viscosity or turbulent viscosity μt, which
represents the momentum and energy transport by diffusion by the eddies or turbulent
fluctuations. Thus the Reynolds stresses can be calculated as the viscous stresses and only
this new variable μt must be modelled.
u v
'
u '
v
'
v '
u
t
(11)
y x
One of the most common turbulence models for the determination of μt is the k-ε model
(Launder & Spalding, 1974). This model introduces two variables to calculate μt, the
turbulent kinetic energy k, and its dissipation rate ε:
2
k
t
C
, (12)
where Cμ represents a semi-empirical dimensionless constant. The temporal and spatial
changes of both variables are described with a transport equation which includes not just
the convection and diffusion but also the creation of turbulence and its dissipation by using several source and sink terms. This advantage justifies the additional expense of the
transport equation turbulence models compared to algebraic turbulence models, which
presume that the turbulence only depends on local conditions. The disadvantage of the k-ε
model is that it assumes the turbulences to be isotropic, which is not strictly true in most of the flows. This model, well established and most widely validated, has already been used to
simulate the flow in cyclones and centrifuges; although in its development this model
assumes a fully turbulent flow, which is only partially applicable to centrifuges.
The k-ε renormalization group model, k-ε RNG, (Yakhot & Orszag, 1986) is an extension of the standard k-ε model that takes into account the effect of swirl on the turbulence by means of an extra source term in the transport equations. Thus the k-ε RNG model exhibits a higher accuracy for swirling flows. The RNG procedure systematically removes the small scales of
motion from the governing equations by expressing their effects in terms of larger scale
motions and a modified viscosity (Versteeg & Malalasekera, 2007). While the standard k- ε
model is appropriate for high-Reynolds-number flows, the RNG theory accounts for low-
Reynolds-number effects. Thus this model is more reliable for a wider class of flows than the Computational Fluid Dynamics (CFD) and
Discrete Element Method (DEM) Applied to Centrifuges
107
standard k-ε model. The k-ε RNG model has been succeeding for previous simulations of
the flow in centrifuges by other groups and in our own research group (Romani Fernandez
& Nirschl, 2009; Spelter & Nirschl, 2010).
The k-ω model (Wilcox, 1988), like the k-ε model, uses two equations to describe turbulence.
Instead of the dissipation rate ε, the specific dissipation or turbulent frequency ω=k/ε is
introduced in this model. The turbulent viscosity is then given by Equation (13). The
accuracy of the model depends on the undisturbed velocity of the fluid outside the
boundary layer which is subject to large fluctuations. This dependence can lead to
significant errors in the calculation (Bardina et al., 1997). Due to the strong dissipation of the turbulence on the wall, no special treatment of the boundary layer at the wall is necessary.
This feature is desired for the exact calculation of the flow near the wall.
k
t
(13)
Comparing the turbulence models, the k-ω model, as a two-equation model, has a similar
range of strengths and weaknesses as the k- ε model. RSM is complex, but it is generally
accepted as the simplest kind of model with the potential to describe all mean flow
properties and Reynolds stresses without case-by-case adjustment. RSM is by no means as
comprehensively validated as the k-ε model and due to the high computational cost it is
not as widely used in industrial flow simulations as the k-ε model. LES, due to the
inherent unsteady nature, is much more computationally expensive than the k-ε and k-ω
models. However, compared to RSM it was proved that it requires only twice the
computational demand of RSM (Ferziger, 1977) as cited in (Versteeg & Malalasekera,
2007). This is not a big difference taking into account the solution accuracy and the ability of LES to resolve certain time-dependent features. In order to investigate the applicability of the different turbulence models to the simulation of the flow pattern in centrifugal
field, different approaches, the k-ε RNG model, the k-ω model, the RSM, and the LES,
were used in this work.
3.3 Boundary conditions, discretization schemata and solver
In order to simplify the simulation, the air is considered as an incompressible gas. This is a reasonable assumption for the operation conditions of atmospheric pressure and for a non-temperature dependent problem. The fluid is defined as an incompressible Newtonian one
with the density and viscosity of water.
The inlet velocity is set to match the desired volume flux. Using a turbulence model, also the turbulence quantities of the inlet flow must be specified. The input of fixed values for k and ε or k and ω are difficult to estimate. Thus these parameters are usually obtained as a
function of the turbulence intensity and a characteristic length which must be set at the
boundaries (Paschedag, 2004). For the multiphase simulations, a value of one was given to
the volume fraction of water at the inlet. A static pressure of 101325 Pa (1 atmosphere) is set as ambient condition for the outlet, defined as a pressure outlet. Sometimes, there is a
backflow through the pressure outlet in order to obey the mass conservation. Therefore it is recommended to set realistic conditions for a possible backflow to avoid convergence
problems. For the cases presented, only backflow of air is allowed.
It is possible to reduce the computational demand by dividing the geometry into periodic
sections. The flow pattern is calculated in one of these segments with periodic conditions at 108
Applied Computational Fluid Dynamics
the intersecting planes. The periodic surfaces were defined with a periodic boundary
condition which uses the flow conditions at one of the periodic surfaces as its cells were the adjacent cells of the other periodic plane. The rotational periodicity must be taken into
account and the rotation axis must be defined. Due to the rotational nature of the system, it is helpful to use a rotating reference frame to perform the calculations. The side and top
walls of the bowl, as well as the inlet accelerator, all defined with no-slip condition, rotate with the same angular velocity as the reference frame.
Another problem emerging from the use of turbulence models is the treatment of
turbulent quantities at the walls. Despite the turbulent flow, there always exists a laminar sublayer at the wall followed by a transient region until the flow can be considered as
turbulent. A common approach is to create a first layer of cells next to the wall with a
width including the entire viscous sublayer and the transition layer. In this layer,
standard wall functions (Paschedag, 2004), most widely used for industrial flows, can be
applied. The wall functions define values for the velocity field and the turbulent
quantities suitable as boundary conditions for the solution in the second cells layer, where the turbulence is fully developed. This approach is particularly suitable for flows with
larger spatial extent in which the thickness of the boundary layer at the wall is small
compared to the extension of the whole domain. To choose the thickness of the first layer,
the criterion of the y+ value (Equation 14) is often used. The value of y+ is a function of
the first layer thickness y, the shear stress at the wal