core and Ag shell; it arises from the electron scattering difference between both metals and
clearly shows the uniform coating for both geometries. The overall dimensions for the
particles, including the pNIPAM shell, are similar before and after the different core growth
processes (Contreras-Caceres, Pastoriza-Santos et al.). The different nanocomposites are
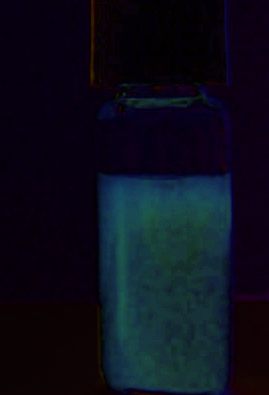
expected to have different optical properties. Fig. 3 shows pictures corresponding to the
aqueous dispersions; it can be observed by simple visual inspection how color changes,
indicating shifting of the localized surface plasmon peak.
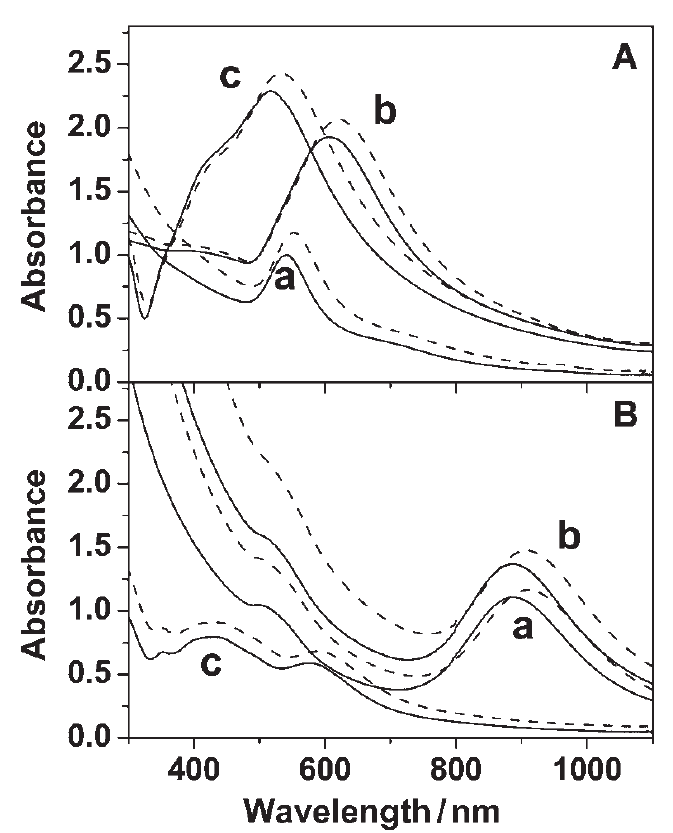
The optical signatures for the different nanocomposites are recorded by UV-visible
spectroscopy and summarized in Fig. 4. It is noticeable (Fig. 4A) that, whereas the growth of
Au spherical cores, from 64 to 103 nm, leads to significant redshift due to retardation effects
(Rodriguez-Fernandez, Perez-Juste et al. 2006), the coating with Ag (of almost the same
thickness), remarkably results in blue-shift and formation of quadrupolar modes, in
agreement with previous works (Rodriguez-Gonzalez, Burrows et al. 2005). In the case of
rod-shaped cores growing with gold (Fig. 4B), there is no displacement of the localized


Surface-Enhanced Raman Scattering Sensors based on Hybrid Nanoparticles
169
A)
B)
C)
D)
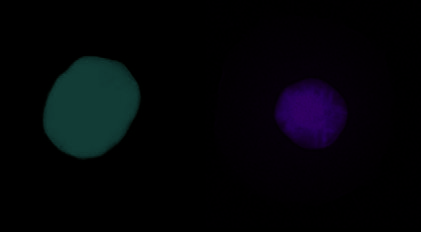
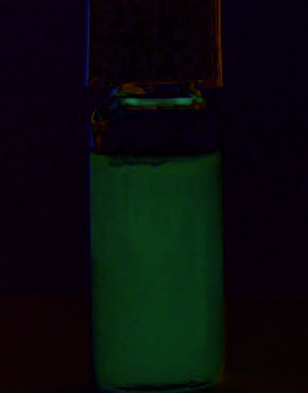
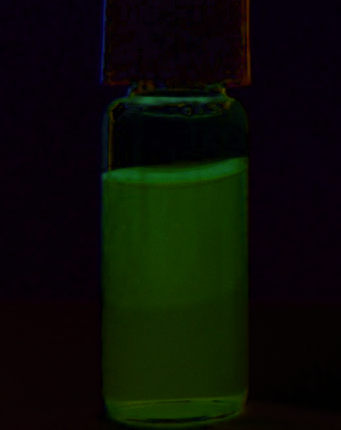
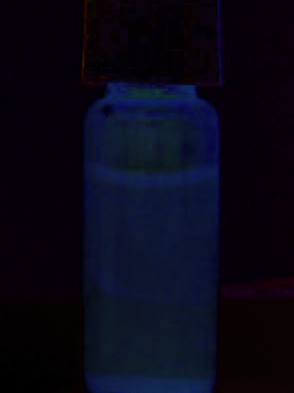
Fig. 3. (Up) Representative TEM images of hybrid nanoparticles with different
morphologies; color is retouched to emphasize the core-shell structure. (Down) Pictures of
their corresponding aqueous dispersions: (A) Au-sphere(103nm)@pNIPAM; (B)
Au(64nm)@Ag(36nm)-sphere@pNIPAM; (C) Au-nanorod@pNIPAM (82.1nm x 21.6 nm); (D)
Au-Ag-nanorod@pNIPAM (76.7 nm x 40.0 nm).
plasmon resonance, only the band intensity increases; this demonstrates that the growth
process is uniform, with no significant change of the aspect ratio. For silver growth, a
dramatic blue-shift of the longitudinal LSPR appears, not only due to the presence of silver
on the surface, but also because the growth process occurs preferentially at the rod sides, in
agreement with recent reports (Sanchez-Iglesias, Carbo-Argibay et al.). The core-grown
nanocomposites preserve the original thermo-responsive properties of the original core-shell
particles used as template. Not only the size can be tuned through temperature changes, but
also the optical properties are greatly influenced. In general, there is a red-shift of LSPR
band as temperature rises above the LCST of 32°C, as a consequence of the polymer shell
collapse. The extent of this red-shift depends on the metal core size, shape, and composition.
These three factors are known to dominate the LSPR sensitivity toward changes of the local
refractive index (Chen, Kou et al. 2008; Sepulveda, Angelome et al. 2009). For instance,
within the explored range of temperature, the LSPR shift for Au-sphere(64 nm)@pNIPAM
particles is 10 nm, whereas for Au(64 nm)@Ag@pNIPAM increases up to 17 nm. The largest
LSPR shift is recorded for Au-nanorod@pNIPAM, about 28 nm, due to the higher
electromagnetic field concentration in rods, which in turn leads to a higher sensitivity for
local refractive index changes (Chen, Kou et al. 2008).
4. Entrapping target molecules: Surface-enhanced Raman analysis.
Gold-pNIPAM core-shell particles used in this section are synthesized by a slightly different
method, consisting of an initial growth of thin polystyrene (PS) on preformed gold
nanoparticles (67 nm) coated with CTAB, followed by in situ polymerization of the pNIPAM
shell (Contreras-Caceres, Sanchez-Iglesias et al. 2008). Particles with larger metal cores
170
Microsensors
Fig. 4. UV-Vis-NIR spectra for aqueous dispersions of different core-shell metal@pNIPAM
nanocomposites. Data are recorded at 22ºC (solid lines) and 44ºC (dash line), which
corresponds to the swollen and collapsed shell states, respectively. (A) Sphere-coated
particles: (a) Au-sphere (64 nm); (b) Au-sphere (103 nm); (c) Au@Ag core-shell sphere. (B)
Rod-coated particles: (a) Au-nanorod; (b) Au@Au nanorod; (c) Au@Ag nanorod (10 time
diluted to avoid scattering effects). Reprinted with permission from (Contreras-Caceres,
Pastoriza-Santos et al.), Copyright (2010) by Wiley-VSC Verlag GmbH Co. KGaA.
(116 nm) are prepared by seeded growth of the 67 nm coated gold cores through the
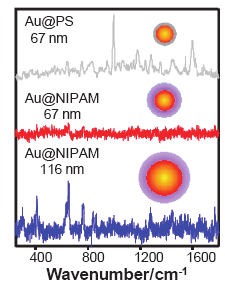
addition of HAuCl4 and ascorbic acid as reducing agent. The SERS spectrum of gold-
polystyrene particles is shown in Fig. 5. The peaks correspond to ring C=C stretching (1615
cm-1), CH2 scissoring (1461 cm-1), ring breathing (1012 cm-1), and radial ring stretching mode
(646 cm-1), which are characteristic of polystyrene (Hong, Boerio et al. 1993). Interestingly, as
particles polymerize with pNIPAM, the bands disappear showing an effective replacement
of PS by pNIPAM, as also observed in Fig. 5, for both selected core sizes Au@pNIPAM (67
and 116 nm). Both spectra fit band to band, being represented by NH bending (1447 cm-1),
CN stretching (1210 cm-1), CH3 rocking (963 cm-1), CH deformation (866 and 841 cm-1), CC
rocking (766 cm-1), CNO bending (655 cm-1), and CCO out-of-plane deformation (413 cm-1).
There is an important increase in intensity for large gold cores, as result of a considerable
enhancement of the optical properties with increasing size, in agreement with previous
Surface-Enhanced Raman Scattering Sensors based on Hybrid Nanoparticles
171
reports (Kelly, Coronado et al. 2003; Njoki, Lim et al. 2007). The overall SERS intensity
(cross-section) obtained from pNIPAM is low, thus providing an excellent background for
analytical applications. pNIPAM shell with thermoresponsive properties allows to entrap
analyte molecules and approximate them to the metal core (when the polymer collapses)
where Raman enhancement becomes apparent. In addition, shell prevents the
electromagnetic metal particle coupling, with highly reproducible SERS signal and intensity.
The fluorescence intensity of certain adsorbed chromophores can also be improved in such a
way. We present here analytical applications based on SERS, SERRS and surface enhanced
fluoresce (SEF), using gold-pNIPAM nanocomposites through a rational selection of
analytes. All spectra are taken with a LabRam HR Raman equipment (Horiba-Jobin Yvon),
following two kind of experiments. Firstly, the particle dispersion (1mL, 5x10⁻⁴ M in gold)
together the analyte (10 μL, 10-5-10-6 M) are stabilized at 4ºC for 2 h, time enough to reach
thermodynamic equilibrium. Next, samples are excited with a 785 nm laser to collect the
SERS spectra or with 633 nm laser for SFE and SERRS spectra. Thereafter, the samples are
equilibrated at 60ºC for 2 h and again at 4ºC. After each equilibrium step, spectra are
collected under the same experimental conditions. In a second experiment, equilibration
steps are repeated, following the inverse temperature sequence, starting at 60ºC, cooling to
4ºC and heating back to 60ºC.
Fig. 5. (From top to bottom) SERS spectra of Au@PS particles, Au(67nm)@pNIPAM
(obtained by coating Au@PS) and Au(116nm)@pNIPAM (after in situ growth of gold core).
Acquisition time is 50 s. Reprinted with permission from (Contreras-Caceres, Sanchez-
Iglesias et al. 2008), Copyright (2008) by Wiley-VSC Verlag GmbH Co. KGaA.
4.1 Analyte with specific molecular interactions: 1-naphthalenethiol
Raman enhancing properties of Au-pNIPAM nanoparticles are initially tested using 1-
naphthalenethiol (1NAT); this is a small molecule with large affinity for gold (through the


172
Microsensors
thiol group). It is considered a model analyte since it easily diffuses across the porous
polymer shell. Moreover, its SERS spectrum is well established (Alvarez-Puebla, Dos Santos
et al. 2004). As can be seen in Fig. 6a, the Raman spectrum is dominated by the ring
stretching (1553, 1503, and 1368 cm-1), CH bending (1197 cm-1), ring breathing (968 and 822
cm-1), ring deformation (792, 664, 539, and 517 cm-1), and CS stretching (389 cm-1). The
intensity of the band at 1368 cm-1, corresponding to the ring stretching, is plotted against
temperature for both cooling-heating cycles.
Fig. 6. (a) SERS spectrum of 1-naphtalenethiol dissolved in Au@pNIPAM particle
dispersions. Excitation wavelength λex= 785 nm. (b, c) Variation of the intensity of the band
at 1368 cm-1, ring stretching highlighted in yellow, as a function of gold-core size and
temperature in two different cooling-heating cycles: (b) 4–60-4ºC; and, (c) 60-4-60ºC.
Acquisition time is 2s for all experiments. Reprinted with permission from (Contreras-
Caceres, Sanchez-Iglesias et al. 2008), Copyright (2008) by Wiley-VSC Verlag GmbH Co.
KGaA.
As the analyte is added to the nanoparticle dispersion at 4ºC (Fig. 6b), pNIPAM shells swell,
allowing the analyte to diffuse across the polymer to reach the gold-core surface, to which it
readily chemisorbs. This results in a high SERS intensity, which remains high after gradually
heating up to 60ºC and cooling down back to 4ºC. Instead, when 1NAT is added to the
dispersion at 60ºC, SERS signal is substantially lower (Fig. 6c). However, by cooling down
temperature to 4ºC, the signal surprisingly enhances up to intensities comparable to those of
the previous cycle. Furthermore, the high signal remains stable during subsequent
temperature changes. The results can be explained by considering the volume transition
exhibited by the pNIPAM shell; above 32ºC, shell changes from water-swollen to shrunken
states, being the process totally reversible (Sierra-Martin, Choi et al. 2005). Thereby, as shells
remain collapsed at 60ºC, the diffusion of 1NAT through the network is hindered and the
gold surface is not longer accessible, giving then low signal. Once the temperature cold
down, the analyte adsorbs on the core and retains there regardless the gel swelling state. We
suggest that 1NAT forms a covalent bound at the gold surface, which is consistent with the
disappearance of the SH stretching peak in the SERS spectra and also with previous reports
(Pearson 1963; Pearson 1966). It is interesting to note that the enhancement provided by the
larger gold core (116 nm) is considerable higher, partly because of the better match between
the excitation wavelength (785 nm) and the plasmon band (Creighton, Blatchford et al.
Surface-Enhanced Raman Scattering Sensors based on Hybrid Nanoparticles
173
1979); as gold core size increases, the plasmon band shifts to higher wavelengths (Fig. 4).
The enhancement factor calculated for this core-shell system is EF=5.16x10⁵, a rather high
value if we take into account that 1NAT does not present substantial charge-transfer
enhancement (the so-called chemical effect) (McFarland, Young et al. 2005). The polymer
shell prevents the electromagnetic coupling between particles, and hence the formation of
hot spots. The enhancement factor is estimated by comparing the signal of the analyte with
and without hybrid particles; it is given by equation EF = ( IAVA/IBVB) (Alvarez-Puebla, Dos Santos et al. 2007), where VA, VB are the probed volumes, IA, IB the respective SERS
intensities and f a correction factor that considers the concentration ratio of the target
molecule in both experiments. We note that the forthcoming SERS experiments will be
developed only with the Au(116nm)@pNIPAM system, provided that it induces the best
Raman enhancement.
4.2 Non-interacting analytes
4.2.1 Nile Blue A
A second demonstration of the potential applications of the Au-pNIPAM nanocomposite is
developed for a common dye, Nile Blue A (NBA). This molecule is slightly larger than
1NAT. In addition, it contains an amine functional group which diminishes the affinity for
gold surfaces respect to 1NAT (Pearson 1963; Pearson 1966). NBA molecules show different
spectra, either SERS or SEF/SERRS, depending on the excitation wavelength. Upon
excitation with near-IR laser line (785 nm), far away from the electronic absorption band
(Alvarez-Puebla, Contreras-Caceres et al. 2009), NBA supported onto the metal core will
produce a normal SERS signal. On the other hand, if NBA is excited with a red laser (633
nm), perfectly matching the absorption band, either SERRS or SEF will be produced,
depending on the distance to the metal surface. Under these conditions, as the analyte is
close enough to the gold, fluorescence can be quenched; however, if the molecule is not as
close, it will feel the electromagnetic field enhancement generated by metallic core. Despite
SERS and SERRS spectra overlap band to band, their relative intensities are not similar; this
is because to the SERRS signal is not only influenced by the surface selection rules
(Moskovits and Suh 1984; Moskovits 1985), but also by the resonance effects (Long 2002).
Fig. 7 illustrates both SERS and SERRS spectra for NBA molecules immersed into the
nanoparticle dispersion; spectra are characterized by the ring stretching (1643, 1492, 1440,
1387, 1351, and 1325 cm-1), CH bending (1258, 1185 cm-1), and the in-plane CCC and NCC
(673 cm-1), CCC and CNC (595 cm-1), and CCC (499 cm-1) deformations (Lu, Mei et al. 2006).
The bands at 673 and 595 cm-1 are significantly more enhanced for SERRS than for SERS,
indicating that they correspond to the chromophore (phenoxazine), whereas the electronic
resonance tends to enhance scattering bands from chemical groups absorbing the excitation
laser line. In addition, SEF spectra is very similar to those obtained for standard
fluorescence, with maximum emission at 668 nm (Aslan, Lakowicz et al. 2005). Regarding
the temperature influence, as the analyte NBA is added to the particle dispersion at 4ºC and
excited with NIR laser line (785 5nm), SERS intensity is very weak (Fig. 7a). Unlike the
results obtained for 1NAT, where the intensity remains constant with temperature, here the
intensity notably increases as shell collapses at 60ºC and diminishes again after cooling back
to 4ºC . When the same sample is excited with a laser operating at 633 nm, the spectrum of
the initial, swollen sample shows an intense fluorescence of about 16-fold the normal
fluorescence. Instead, as temperature rises to 60ºC (collapsed shell), fluorescence quenches
and SERRS spectrum is recovered. After subsequent cooling to 4ºC, less-intense SERRS
spectrum can still be identified on top the strong SEF background.


174
Microsensors
Fig. 7. SERS and SEF/SERRS spectra of Nile Blue A as a function of temperature. The
excitation wavelength is λex=785 nm (blue trace) and λex=633 nm (red trace) for SERS and
SEF/SERRS, respectively. Two different cooling-heating cycles are tested: (a) from 4 to 60 to
4ºC; and (b) from 60 to 4 to 60ºC. The acquisition time is 2s. Reprinted with permission from
(Contreras-Caceres, Sanchez-Iglesias et al. 2008), Copyright (2008) by Wiley-VSC Verlag
GmbH Co. KGaA.
Surface-Enhanced Raman Scattering Sensors based on Hybrid Nanoparticles
175
The disagreement between results concerning NBA and 1NAT molecules (for the
temperature cycle 4-60-4 ºC) is attributed to the different affinity between amine and thiol
groups for gold; the retention of NBA molecules on gold surface is less stable than for
1NAT, which causes partial release of NBA, thereby contributing to SERS and SERRS
weakening (concomitantly to SFE enhancement). Interestingly, for the inverse cycle (60-4-60
ºC) (Fig. 7b), strong SEF intensity is recorded at 60ºC, which turns upon shell swelling into a
weak SERRS signal (4ºC) and then to an intense SERRS spectra after final heating up to 60ºC.
These results are interpreted by considering the shell swelling properties as well as the
affinity of the analyte to gold. Due to the low affinity of NBA, even for the particle swollen
state, the analyte does not significantly absorb onto gold cores (weak SERS signal at 4ºC),
but it can be entrapped within the polymer network (strong SEF that completely screens the
SERRS signal). When temperature raises up to 60ºC, the shells collapse and NBA molecules
are entrapped closer to the core, as indicates the notable increase of SERS and SERRS, while
SEF signal is quenched. For the second cycle (60-4-60ºC), a similar behaviour is found;
initially, as particles collapse, only SEF is recorded. Upon particle swelling and subsequent
collapse, NBA molecules are retained in close contact to the gold core surfaces. SERS signal
then recovers. The entrapping mechanism is closely related to the hydrophilic-hydrophobic
transition of pNIPAM microgels and to the microcapillarity effect occurring during particle
collapse (Guerrini, Garcia-Ramos et al. 2006; Guerrini, Garcia-Ramos et al. 2008).
4.2.2. 1-naphthol
SERS enhancement for Au-pNIPAM nanocomposite is finally tested for 1-napthol; this
molecule does not easily adsorb onto conventional gold or silver surfaces, so its SERS
analysis has remain elusive to date. Fig.8 illustrates SERS spectrum, recorded for the first
time for 1-naphthol; it is characterized by CH bending (1447 cm-1), ring stretching (1390 cm-
1), CCC in-plane deformation (842 cm-1), CH out-of-plane deformation, ring breathing (716
cm-1), ring deformation (655 and 584 cm-1) and, ring twisting (477 cm-1), in close agreement
with the Raman assignment previously reported (Lakshminarayan and Knee 1990). SERS
signal is properly identified after shell collapse, from 4ºC to 60ºC; the analyte is first retained
within the swollen polymer networks, at 4ºC and then, brought into contact with the gold
surfaces upon shells collapse. After subsequent cooling, the polymer shells swell again and
1-napthol molecules release the metal surface, resulting in a dramatic loss of SERS signal.
The low affinity of hydroxyl groups of the 1-napthol to gold surfaces is clearly shown in the
reversibility of the SERS signal along the swell-collapse cycles.
5. Improved SERS detection via bimetallic sensors
In the previous section, we have shown the ability of Au@pNIPAM nanoparticles for
entrapping and detecting analytes by means of SERS. Nevertheless, the use of hybrid
particles with small cores and the impossibility of those materials to form hot spots due to
the physical barrier imposed by the polymer, limits the enhancement and imposes a
detection threshold. To overcome this limitation, hybrid materials with different
compositions and morphologies are employed. The first alternative involves controlled
growth of silver shells onto the gold cores, since it is well known that silver is much more
efficient plasmonic material (Zhao, Pinchuk et al. 2008). The second one refers to
morphology changes towards rod-shaped cores, with near field concentration areas at the


