MEMS Gyroscopes for Consumer and
Industrial Applications
MEMS Gyroscopes for Consumer and Industrial Applications
27
279
Segway (2011).
URL: http://www.segway.com
Seidel, H., Aikele, M., Rose, M. & Toelg, S. (2002). Safety relevant microsystems for automotive
applications, Microsystem Technologies 7(5): 244–248.
Senturia, S. D. (2001). Microsystem Design, Kluwer Academic Publishers.
Shakoor, R. I., Bazaz, S. A., Kraft, M., Lai, Y. & ul Hassan, M. M. (2009).
Thermal
Actuation Based 3-DoF Non-Resonant Microgyroscope Using MetalMUMPs, Sensors
9(4): 2389–2414.
Shearwood, C., Ho, K. Y., Williams, C. B. & Gong, H. (2000).
Development of a
levitated micromotor for application as a gyroscope, Sensors and Actuators A: Physical
83(1-3): 85 – 92.
Soderkvist, J. (1991). Piezoelectric beams and vibrating angular rate sensors, Ultrasonics,
Ferroelectrics and Frequency Control, IEEE Transactions on 38(3): 271–280.
Söderkvist, J. (1994). Micromachined gyroscopes, Sensors and Actuators A: Physical 43(1-3): 65
– 71.
Sparks, D., Zarabadi, S., Johnson, J., Jiang, Q., Chia, M., Larsen, O., Higdon, W. &
Castillo-Borelley, P. (1997). A CMOS integrated surface micromachined angular
rate sensor: it’s automotive applications, Solid State Sensors and Actuators, 1997.
TRANSDUCERS ’97 Chicago., 1997 International Conference on, Vol. 2, pp. 851–854
vol.2.
Stewart, R. E. (2009). Micro hemispheric resonator gyro, U.S. Patent 2009/0031831.
STMicroelectronics (2010).
URL: http://www.st.com/stonline/products/literature/ds/15812/lpr530al.pdf
Stringer, J. (2000).
The Air Force Institute of Technology (AFIT) Micro Electro-Mechanical
Systems (MEMS) Interferometric Gyroscope (MiG), Master’s thesis, Air Force Institute
of Technology (AFIT).
Tanaka, K., Mochida, Y., Sugimoto, M., Moriya, K., Hasegawa, T., Atsuchi, K. & Ohwada,
K. (1995). A micromachined vibrating gyroscope, Sensors and Actuators A: Physical
50(1-2): 111 – 115.
Tang, W., Nguyen, T.-C. & Howe, R. (1989).
Laterally driven polysilicon resonant
microstructures, Micro Electro Mechanical Systems, 1989, Proceedings, An Investigation
of Micro Structures, Sensors, Actuators, Machines and Robots. IEEE, pp. 53–59.
Tsai, N.-C., Huang, W.-M. & Chiang, C.-W. (2009). Magnetic actuator design for single-axis
micro-gyroscopes, Microsystem Technologies 15(4): 493–503.
Vellekoop, M. J. (1998). Acoustic wave sensors and their technology, Ultrasonics 36(1-5): 7 – 14.
Ultrasonics International 1997.
Voss, R., Bauer, K., Ficker, W., Gleissner, T., Kupke, W., Rose, M., Sassen, S., Schalk, J., Seidel,
H. & Stenzel, E. (1997). Silicon angular rate sensor for automotive applications with
piezoelectric drive and piezoresistive read-out, Solid State Sensors and Actuators, 1997.
TRANSDUCERS ’97 Chicago., 1997 International Conference on, Vol. 2, pp. 879–882
vol.2.
Weinberg, M. & Kourepenis, A. (2006). Error sources in in-plane silicon tuning-fork MEMS
gyroscopes, Microelectromechanical Systems, Journal of 15(3): 479–491.
Yazdi, N., Ayazi, F. & Najafi, K. (1998). Micromachined inertial sensors, Proceedings of the IEEE
86(8): 1640–1659.
28
280
Will-be-set-by-IN-TECH
Microsensors
Yokota, S., Imamura, T., Takemura, K., Edamura, K. & Kumagai, H. (2008).
A liquid
rate gyroscope using electro-conjugate fluid, Intelligent Sensors, Sensor Networks and
Information Processing, 2008. ISSNIP 2008. International Conference on, pp. 459–464.
Zhou, J., Yan, G., Zhu, Y., Xiao, Z. & Fan, J. (2005). Design and fabrication of a microfluid
angular rate sensor, Micro Electro Mechanical Systems, 2005. MEMS 2005. 18th IEEE
International Conference on, pp. 363–366.
Zhu, R., Ding, H., Su, Y. & Zhou, Z. (2006). Micromachined gas inertial sensor based on
convection heat transfer, Sensors and Actuators A: Physical 130-131: 68 – 74.
13
Planar Oxygen Sensors for Non Invasive
Imaging in Experimental Biology
Henning Tschiersch1, Gregor Liebsch2, Achim Stangelmayer2,
Ljudmilla Borisjuk1 and Hardy Rolletschek1
1Institut für Pflanzengenetik und
Kulturpflanzenforschung (IPK), Gatersleben,
2PreSens Precision Sensing GmbH, Regensburg,
Germany
1. Introduction
The presence of molecular oxygen is a sine qua non for aerobic metabolism. In both plant and
animal mitochondria, it acts as the terminal electron acceptor for oxidative phosphorylation
occurring during cellular respiration, and is necessary for the generation of ATP, the
common energy currency within the living cell (Atkinson, 1977; Cooper, 2000). It is the
major by-product of photosynthesis in which plant biomass is accumulated by the
conversion of carbon dioxide into polymeric compounds. Since respiration and
photosynthesis are so fundamental to life on earth, an understanding of the mechanisms
underlying oxygen consumption, production and homoeostasis has become a significant
field of both biological and biotechnological research (Volkmer et al., 2009).
Oxygen (micro-) sensors, which are widely used in the life sciences, are designed to provide
a precise measurement of the concentration of oxygen within a localized region of a tissue or
an organ (Borisjuk & Rolletschek, 2009). Most of these devices have been based on
miniaturized Clark-type electrodes (Revsbech & Jørgensen, 1986), in which oxygen diffuses
into the sensor via a permeable membrane, following which its reduction at the cathode
generates a measurable electrical current. This approach can deliver a spatial resolution at
the low µm scale. Increasingly this technology is being replaced by optical oxygen
microsensors (micro-optodes) based on fibre optic materials (Klimant et al., 1995;
Rolletschek et al., 2009), in which the concentration is assessed in tapered glass fibres of tip
size ~50µm via the dynamic quenching of a luminophore. This approach enjoys several
advantages over the electrochemical detection system, as detailed elsewhere (Kühl &
Polerecky, 2008; Rolletschek et al., 2009).
Importantly, microsensor-based approaches are invasive, which means that a given
biological sample cannot be readily studied over a prolonged time period. Furthermore, the
internal structure of most biological samples is far from homogeneous, with complex
compartmentation being the norm. As a result, whole tissue measurements can only reflect
the mean performance of a tissue, and cannot report variation between distinct
compartments. This loss of richness compromises the value of such data for elucidating the
biology of the tissue as a whole. At best, conventional sensor systems assess oxygen
282
Microsensors
concentrations across a transect, leaving its two dimensional distribution unknown. Lifting
this limitation requires the development of a planar sensor.
Here, we present a novel oxygen sensing approach, in which image processing has been
combined with optical sensor technology. The optical sensor foil (i.e. the planar optode)
attached to the surface of the sample translates the oxygen signal into a light signal, which is
then captured and interpreted pixel by pixel by a digital camera. Since a single image
captures an array of sensor points, the system permits an instantaneous two-dimensional
mapping of oxygen distribution. While some analagous approaches have already been
described in the literature (Liebsch et al., 2000; Glud et al., 2005; Kühl & Polerecky, 2008), the
system we describe here represents a significant improvement with respect to spatial
resolution, handling and image processing, and eventually ease of use. Two applications of
the system are described in some detail: the first involves a respiring (oxygen consuming)
root of oilseed rape ( Brassica napus), and the second a photosynthetically active (oxygen
generating) leaf of Cabomba caroliniana, an aquatic perennial herbaceous plant. In both,
marked oxygen gradients were detected across both time and space. In combination with
the use of specific inhibitors, the planar sensor system can be expected to permit a spatially
well resolved analysis of respiration or photosynthesis. We conclude that the new planar
sensor setup provides fascinating opportunities for research in all areas of life sciences.
2. Planar oxygen sensors – design, calibration and applications
The following chapters provide an overview on (i) the technical features of the novel planar
sensor setup, and (ii) the possibilities for its use in plant biology, in particular to study
respiration (oxygen consumption) and photosynthesis (oxygen production).
2.1 Experimental design for life time imaging of oxygen
Digital revolution in photography induced a giant trend towards capturing images and
creating movies of nearly everything one can think of. Beside scientific and industrial
cameras the market of consumer imaging devices is constantly growing and continually
new products are launched showing increased resolution while being miniaturized. The
enhancement of image quality and downsizing affects all market segments of consumer
cameras, high-quality SLR cameras as well as low-tech webcams and mobile phone cameras.
As a result, the use of such consumer devices is also of increasing interest in the field of
opto-chemical sensing where the response of a fluorescent sensor is recorded in order to
measure chemical analytes. Typically, for this application fairly bulky and sophisticated
camera systems (Holst et al., 1998; Schröder et al., 2007; Kühl & Polerecky, 2008) are used which support time resolved measurement. Measuring a lifetime dependent parameter is
generally preferred because of the favourable accuracy due to suppressing common
interferences including heterogeneous lightfield or sample coloration and auto-fluorescence
allowing even transparent sensor foils (Holst et al., 2001). This is not possible if using even
high-tech standard consumer cameras which allow ratiometric calibration schemes at best.
However, beside the restriction of transparent sensors ratiometric imaging has proved to be
also an excellent solution for measuring analyte contents of a sample quantitatively and two
dimensionally (Wang et al., 2008). Then, it depends on the sample target and analytical
problem if the possibility of miniaturisation and mobility overcompensates the restriction.
Especially in biological application fields of imaging with fluorescent optical sensors it is
desirable to use compact devices which are close to pocket size and can easily be taken to
Planar Oxygen Sensors for Non InvasiveImaging in Experimental Biology
283
the place of measurement. As a result, complex biological systems are not disturbed and can
be measured “as is” in their natural environment or green house. New reports address the
topic of applying portable consumer technology by using SLR cameras (Wang et al., 2010) or
even mobile phones (Filippini & Lundstrom, 2006) with the side-effect of substantially
reducing the costs for imaging devices at the same time. However, in these solutions the
question about suitable optical filters, macro lense and light source combinations is not
sufficiently solved. Especially a micrometer resolution is indispensable if investigating
biological processes of plant seeds, embryos, collenchyma or rhizospheres. Also in other
medical and biotechnical applications a high resolution is needed including monitoring
phase transitions in aquatic biology, mini bioreactors, tissue engineering and skin
microcirculation. Therefore, we developed the idea of using consumer camera technology
further and identified a type which fits perfectly to the demands of fluorescent optical
imaging: the USB microscope. The results presented here were measured with a prototype
of new imaging product series “VisiSens” (PreSens GmbH, Regensburg, Germany).
The market of USB microscopes is allocated to many types showing huge differences in
image quality. We based our development on a current high-end USB microscope with good
sensitivity and image quality and improved it for imaging fluorescence-optical sensors by
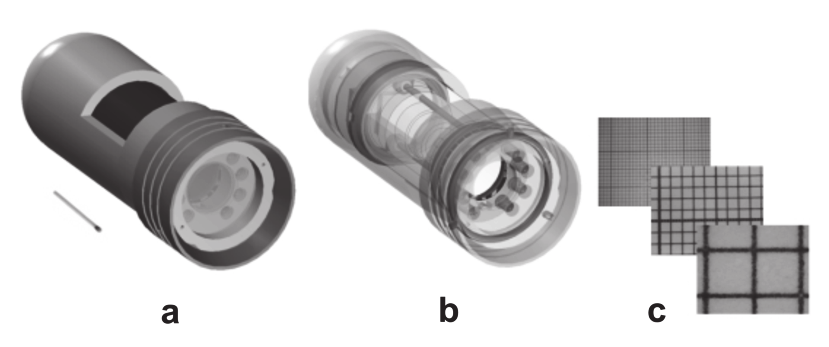
integrating an optic block with high quality LED PCB and optical filters. Figure 1 shows a
solid (left panel) and a transparent (middle panel) technical drawing of the measurement
head, showing its compactness and the arrangement of the respective components. The
three images beside show millimeter paper measured with different magnification settings.
Maximum magnification is approximately 200-fold where the field of view is ~ 2.5 x 2.0 mm.
Fig. 1. (a) Solid and (b) transparent technical drawing of the compact measurement head
incorporating a USB-microscope for imaging fluorescent sensor foils. Camera and light
source are powered via standard USB connector. (c) Images of millimeter paper
demonstrating the magnification up to 200-fold.
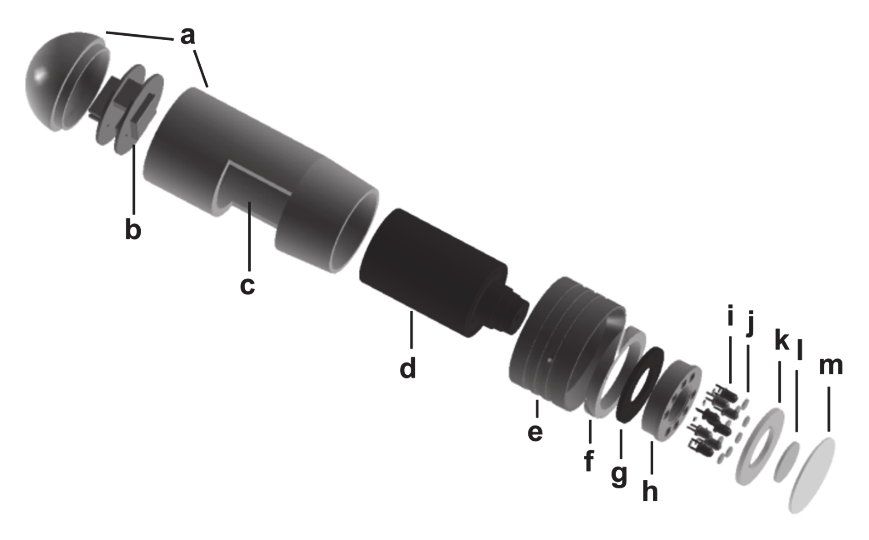
Figure 2 shows an explosion drawing of the USB microscope where the components are
addressed in detail. The all-aluminium detector head (a) integrates a color RGB CMOS chip
(b), a microscope lense (c) with manual focus, 8 blue emitting LEDs (i) which are driven by a
printed circuit board (PCB) (g) and aligned in an aluminium block (h) and optical filters for
light diffusion (j), excitation (k) and emission (l). The up to 200-fold magnified images are
recorded with a 1.3 megapixel (1280 x 1024) color chip which results in more than 300,000
independent sensing points (= pixel) for the respective sensor response (i.e. color channel of
the RGB chip). Maximum spatial image resolution is ~ 2.5 mm per 1280 pixel (~ 2 µm per
284
Microsensors
pixel). Maximum spatial sensor resolution depends on the sensor used and is typically ~ 25
to 100 µm. Power supply of the camera and the LED light source is provided via the
standard USB connector which makes the system laptop compatible and a portable device.
The dimensions of the detection head are 10 cm in length and 3.8 cm in diameter, the
working distance is typically from 1 to 5 cm. The camera can be used free hand or mounted
to a stand.
Fig. 2. Explosion drawing of the PreSens USB-microscope “VisiSens” optimized for imaging
of fluorescencent sensor foils: (a) aluminium housing, (b) RGB CMOS-chip, (c) opening for
manual focus, (d) microscope lense, (e) filter tube, (f) mounting and adjustment ring
(g) transmitter PCB, (h) LED reflector block, (i) LEDs, (j) diffusor, (k) short pass excitation
filter, (l) long pass emission filter and (m) sapphire glass.
For the measurement the imaging system uses flexible sensor foils which allow two
dimensional recording of oxygen distributions in aqueous phase over an area typically
ranging from 5 x 5 mm2 up to 40 x 40 mm2. The planar sensors consist of an oxygen sensitive
dye and a reference dye which are immobilized in an oxygen permeable polymer matrix
and fixed on a transparent polyester support and overlaid with a white oxygen transparent
layer for optical isolation. We used a PreSens sensor foil which is not described here but
similar to that described in detail by Wang et al., (2010).
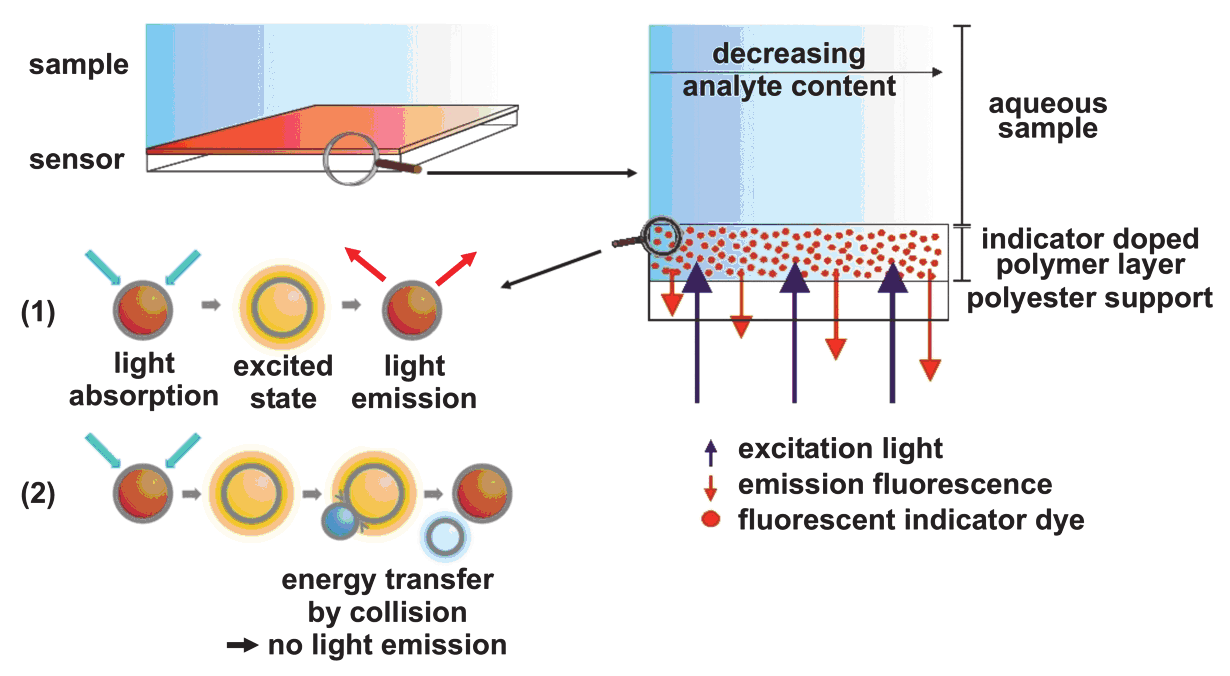
During the measurement the sensitive layer is in contact with the sample and the
fluorescence is measured from the backside. Every single indicator dye molecule is
interacting independently with oxygen in the form that the red fluorescence of the sensitive
dye is dynamically quenched. This means that the energy of the excited dye is transferred to
the oxygen molecule by collision (see Fig. 3) and consequently the intensity of the sensitive
dye is reduced with increasing oxygen content of the sample.
The reference dye, however, is not affected by oxygen and shows constantly a green light
signal. The working range of the oxygen sensor covers the typical biological range from 0 to
100% air saturation (corresponding to 6.04 mL of oxygen per liter freshwater at 25 °C and 101.3
kPa standard atmosphere). The sensors can be shaped to any desired geometry using a scissor.
Planar Oxygen Sensors for Non InvasiveImaging in Experimental Biology
285
A
B
Fig. 3. (A) Schematic of the sensor foil and principle of dynamic fluorescence quenching. The
sensor responds to oxygen by passing the energy of an excited state dye via collision to the
oxygen molecule. This results in fluorescence quenching with increasing oxygen content of
the sample. (B) Measurement set-up. The sensor consists of an indicator doped polymer
layer which is fixed on a transparent polyester support. During the measurement the sensor
has to be in direct contact with the sample. The sensor response is measured from outside
through a transparent window of the respective vessel.
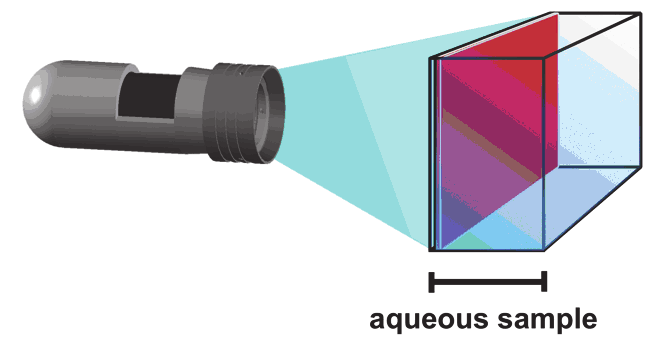
For quantitative evaluation of the sensor response we applied a ratiometric calibration
scheme. The sensitive dye and reference dye are excited with the identical light source at the
same time but emit at different bands of wavelength. In our case, both dyes are excited with
blue light and while the sensitive dye emits red light, the reference emits green light. We
selected dyes whose emission bands of wavelength meet exactly the red and green channel
sensitivity of our color RGB chip. This enables to obtain the green reference information
independently from the red sensor information within a single image at the same time. A
quantitative evaluation is done by rationing the red and green channel of the RGB image in
286
Microsensors
order to reference out the main interferences of intensity based measurements namely
inhomogeneous light field and dye concentration including varying sensor layer thickness.
The respective oxygen content is computed from the ratio applying a calibration function
which was derived from measuring the sensor response at known oxygen concentrations in
a chamber (Figure 4).
A
B
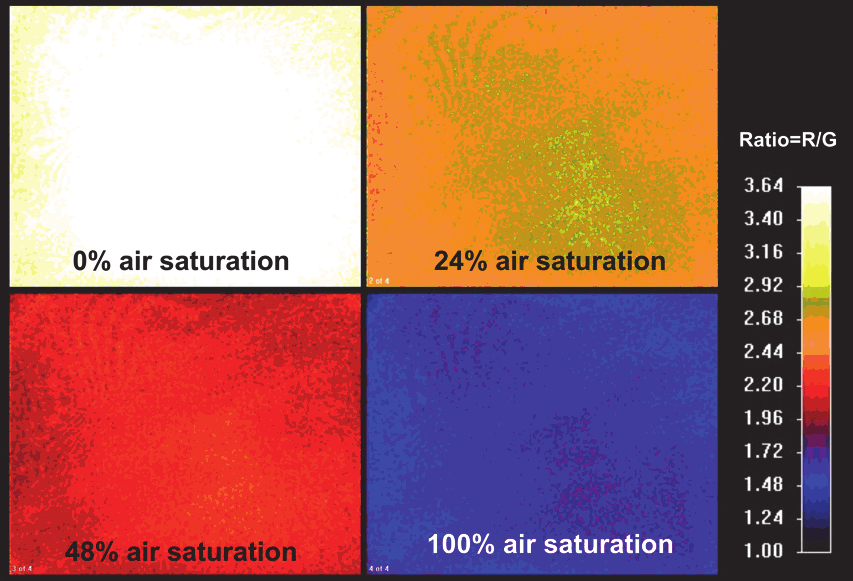
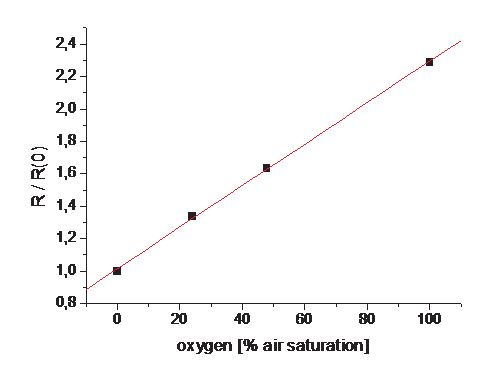
Fig. 4. (A) Calibration Images and data. The sensor was exposed to different oxygen gas
mixtures and the response was imaged. (B) The Stern-Vollmer plot leads to a linear relation
which was used for calculating the respective oxygen contents of the measurement images.
Planar Oxygen Sensors for Non InvasiveImaging in Experimental Biology
287
2.2 Application of planar optical sensors for oxygen measurements on plants
Unlike animals, plants are both producers and consumers of oxygen via photosynthesis and
cellular respiration, respectively. Plant leaves, stems and seed tissues generally possess
chloroplasts, producing oxygen under illumination ((Borisjuk and Rolletschek, 2009;
Tschiersch et al., 2011) whereas roots are a typical example of non-green tissues. Their oxygen
homoeostasis and exchange capabilities depend on the developmental state (age), several
tissue characteristics (e.g. cuticula) as well as environmental conditions (e.g. temperature)
(Armstrong et al., 1994, 2009). In particular, the complex anatomy of tissues often hampers
oxygen diffusion, thereby causing steep diffusion gradients and local oxygen deficiencies.
Planar oxygen sensors are an alternative to conventional microsensor-based techniques, and
allow to viualize the oxygen dynamics between tissues and surrounding media. Here, we
demonstrate the applicability of the planar sensor system to study oxygen dynamics in two
plant models: (i) the respirating (O2-consuming) root system of the crop plant oilseed rape
( Brassica napus), and (ii) the photosynthetically active (O2-producing) leaf of the water plant Cabomba caroliniana.
2.2.1 Imaging of oxygen consumption in living plant roots
Several contrasting plant species, that differ in their relative growth rates (herbs, grasses,
shrubs and trees), possess respiration rates in a relative narrow range between 20 and 52
nmol oxygen (g DW)-1 s-1 (Loveys et al., 2003). Similar values were reported for roots of crop
plant seedlings using clark-type electrodes (Tab. 1). For roots of oilseed rape seedlings we
measured mean respiration rates of ~ 79 nmol oxygen (g DW)-1 s-1 (own unpublished data).
Root respiration rate
Species
References
[nmol O2 (gDW)-1 s-1]
Oilseed rape ( Brassica napus)
79.3 this
study
Barley ( Hordeum vulgare)
16.2
Bloom et al., 1992
Wheat ( Triticum aestivum)
64.0
Kurimoto et al., 2004
Rice ( Oryza sativa)
39.1
Kurimoto et al., 2004
Corn ( Zea mays)
56.7
Hejl & Koster, 2004
Potato ( Solanum tuberosum)
14.8
Bouma et al., 1996
Tomato ( Solanum
15.8
Hadas & Okon, 1987
lycopersicum)
Pea ( Pisum sativum)
69.2
DeVisser et al., 1986
Soybean ( Glycine max. )
67.5
Millar et al., 1998
Table 1. Root respiration rates of various crop plants
Using the planar oxygen sensor we here aimed to visualize quantitatively the oxygen
consumption of intact roots. For this purpose oilseed rape was grown on 0.9% Difco-agar for
14 days. For the measurement the root segments of seedlings were covered with the
transparent sensor foil. The use of transparent foils is of special importance because it allows the alignment between the sample structure and the measured oxygen distribution. The
sample was enclosed by an incubation chamber to limit oxygen diffusion from the outside.
This custom-made system allowed the combined imaging of the root (Fig. 5a) and the
oxygen concentration (Fig. 5b). In our experiment, the oxygen distribution in the sample
was followed over six hours with measuring points every 15 min. Based on the decline in
oxygen concentration over time, the respiration rate of the central root zone was calculated
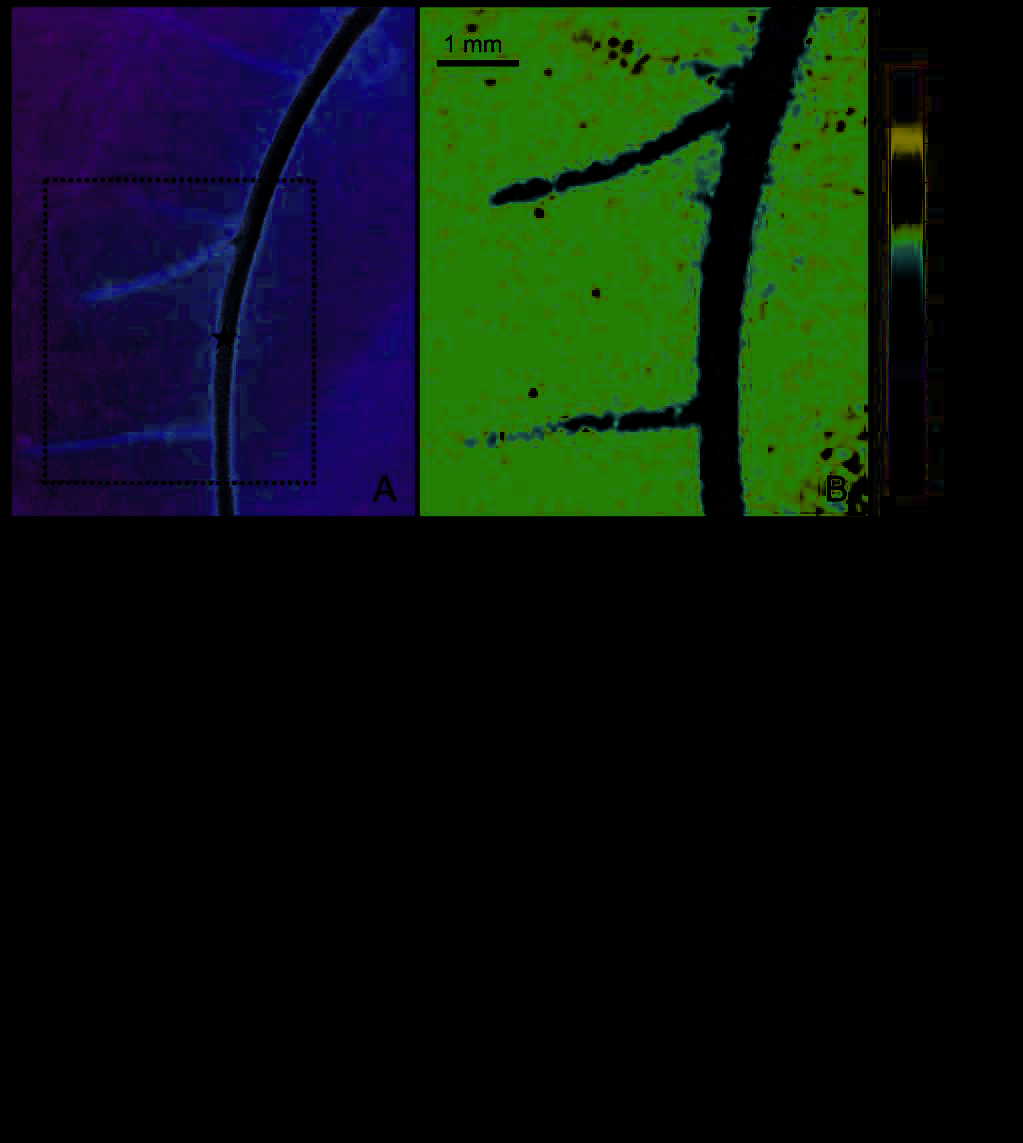
288
Microsensors
as 0.015 % air saturation min-1, which corresponds to ~ 12.5 µmol oxygen h-1. The final
image of oxygen distribution in Fig. 5b demonstrates that oxygen consumption of the root
system can be mapped for distinct root regions with sub-millimetre resolution using the
planar sensor setup. It should be noted that the use of thin sensor foils and incubation
chambers is preferable, because this reduces diffusive smearing of the spatial oxygen
distribution, which otherwise can mask the true oxygen dynamics as well as its gradients.
Thus, it allows maximizing the spatial resolution in oxygen mapping.
Fig. 5.