Donner Quartz Rotation Sensor (QRS) (quartz cut axis orientation ≡ z-axis) (Gupta & Jenson, 1995; Knowles & Moore, 2004); (b) electrodes configuration for generating the drive tine
bending vibration; (b) electrodes configuration for sensing the pickup tine bending vibration.
16
268
Will-be-set-by-IN-TECH
Microsensors
Weinberg & Kourepenis, 2006)) or canceling the error from the measurement (using a
feed-forward cancellation scheme - (Antonello et al., 2009; Saukoski et al., 2007)).
• improving sensor linearity and bandwidth.
This is usually achieved by exploiting a
closed-loop sensing interface, in which the sense motion is nulled by employing a control
loop. The feedback signal used for nulling the sense motion contains the angular velocity
information, which can be extracted with a basic synchronous baseband demodulation
circuit. When a digital output must be provided, the feedback signal can be oversampled
and quantized with a coarse quantizer: in this case, the closed-loop sensing interface
behaves as a (electromechanical) ΣΔ modulator (Dong et al., 2008; Petkov & Boser, 2005).
• improving scale factor thermal stability. A temperature compensation loop can be sometimes
integrated on-board to reduce the sensitivity of the scale factor to temperature variations
(Jiancheng & Jianli, 2009).
Additional electronic functions may include self test and calibration, bias compensation, etc.
4. Industrial requirements
The specifications and test procedures for a single-axis CVG-based angular rate sensor have
been standardized in ( IEEE Standard Specification Format Guide and Test Procedure for Coriolis
Vibratory Gyros, 2004). The standard requirements for a CVG are specified in terms of its
performances, its mechanical and electrical interface characteristics, the environmental conditions, the sensor life time and reliability (usually measured as Mean Time Between Failure - MTBF).
The performance of a CVG is specified according to the following quantities, whose
definitions are taken from ( IEEE Standard for Inertial Sensor Terminology, 2001):
• Input range: the interval between the input limits within which a quantity is measured. The
input limits are defined as the extreme values of the input, generally plus or minus, within
which performance is of the specified accuracy. The full-scale (FS) input is the maximum
magnitude of the two input limits.
• Accuracy (or linearity error): the deviation of the output from a least-squares linear fit of the input-output data. It is generally expressed as a percentage of the input full-scale, or a
percent of output, or both.
The definition implicitly assumes that the ideal sensor exhibits a linear input-output
behavior (i.e. the static input-output sensor characteristic is a linear function).
• Scale factor 1 : the ratio of a change in output to a change in the input intended to be
measured, typically specified in [ V/ ◦/ s]. It is evaluated as the slope of the least squares straight line fit to input-output data.
In the ideal case, the scale-factor is constant over both the entire input range and the whole
sensor lifespan. In the real case, the following quantities are used to judge the scale factor
quality:
– asymmetry error: the difference between the scale factor measured with positive input
and that measured with negative input, specified as a fraction of the scale factor
measured over the input range.
1 Sometimes the term sensitivity is used as a synonym for scale factor. However, according to ( IEEE
Standard for Inertial Sensor Terminology, 2001), the term sensitivity is reserved for denoting the ratio of a change in output to a change in an undesirable or secondary input.
MEMS Gyroscopes for Consumer and
Industrial Applications
MEMS Gyroscopes for Consumer and Industrial Applications
17
269
– scale factor stability: the variation in scale factor over a specified time of continuous operation. Ambient temperature, power supply and additional factors pertinent to the
particular application should be specified.
– scale factor sensitivities: the ratio of change in scale factor to a change in an
undesirable input, such as the steady state operating temperature ( scale factor
temperature sensitivity) or the constant acceleration along any axis ( scale factor acceleration sensitivity). Additional sensitivities may be specified such as those due to variations in
supply voltage (including frequency, voltage, ripple, starting and operating current),
orientation, vibration, magnetic field, radiation, and other environments pertinent to
the particular application.
• Resolution: the smallest input change, for inputs greater than the noise level, that can be
reliably detected. It is usually evaluated as the minimum input change that produces a
change in output equal to some specified percentage (at least 50%) of the change in output
expected using the nominal scale factor.
• Drift rate: the portion of gyro output that is functionally independent of input rotation.
The systematic component of the drift rate ( systematic drift rate) includes:
1. Bias (or zero rate output - ZRO): the average over a specified time of gyro output
measured at specified operating conditions that has no correlation with input rotation.
Bias is typically expressed in [ ◦/ s] or [ ◦/ hr].
2. Environmentally sensitive drift rate: the components of systematic drift rate that are
sensitive to temperature (steady state, gradient, ramp), acceleration, vibration and
other quantities.
The random component of the drift rate ( random drift rate) includes:
1. Angle Random Walk (ARW): the angular error buildup with time that is due to white
√
√
noise in angular rate, typically expressed in [ ◦/ hr/ hr] or [ ◦/ s/ hr].
2. Rate Random Walk (RRW): the drift rate error buildup with time that is due to white
√
noise in angular acceleration, typically expressed in [ ◦/ hr/ hr].
3. Bias Instability: the random variation in bias as computed over specified finite sample
time and averaging time intervals, characterized by a 1/ f power spectral density,
typically expressed in [ ◦/ hr].
• Bandwidth: the range of frequency of the angular rate input that the gyroscope can detect.
Typically specified as the cutoff frequency coinciding to the − 3 dB point. Alternatively, the frequency response or transfer function could be specified.
• Activation time: it includes the turn-on time, i.e. the time from the initial application of power until a sensor produces a specified useful output, though not necessarily at
the accuracy of full specification performance, and the warm-up time, i.e. the time from
the initial application of power to reach specified performance under specified operating
conditions.
The mechanical and electrical requirements are usually specified in terms of:
• Outline, mounting dimensions, weight
• Gyro axes: the input axis (IA) is the axis about which a rotation of the case causes a maximum output; the input reference axis (IRA) is the direction of an axis (ideally parallel
to an input axis) as defined by the case mounting surfaces, or external case markings, or
both. In case of a multi-axis gyroscope, more than one IA (and, correspondingly, IRA) can
be defined.
18
270
Will-be-set-by-IN-TECH
Microsensors
• Seal: CVGs may be sealed using vacuum, gas or ambient environment.
• Acoustic noise emission
• Electrical impedances:
load impedances and impedances of excitation, monitoring,
temperature sensing and test circuits.
• Input power, grounding
• Output signals: the type and characteristics of output signals, such as analog voltage or
current, parallel or serial digital, or incremental angle pulses.
• Electromagnetic interference and electrostatic discharge (ESD) immunity.
The environmental requirements specify the environmental conditions (limits) and
perturbations during storage, transport and/or operation under which the sensor preserves
its functionality. Environmental characteristics account for:
• Linear and angular accelerations: both the acceleration (axis, direction, intensity) and exposure time should be defined.
• Linear and angular vibrations: both axes and direction of vibration should be defined. For a deterministic vibration, specifications include the type of vibration (e.g. sinusoidal) and
its characteristics (e.g. amplitude, frequency sweep range, exposure time). For a random
vibration, its spectral characteristic (e.g. power spectral density - PSD) is usually specified.
• Mechanical shock: it is specified in terms of axis, direction, wave shape, intensity (usually measured as a peak value in [ m/ s 2] or a multiple of the gravity acceleration g) and duration.
• Temperature range
• Others: may include ambient air pressure, humidity, electromagnetic fields, etc.
Conventionally, gyroscopes are classified into three different categories based on their
performance: inertial-grade, tactical-grade, and rate-grade devices (Yazdi et al., 1998). Table 1
summarizes the requirements for each of these categories.
RLGs, together with HLGs (R.R.Ragan (ed), 1984), are currently the angular rate sensors with
highest performance available in the market, and exhibit inertial grade performances. They
are used in the most demanding applications, especially those requiring extremely high scale
factor stability (typically, high precision space applications). FOGs normally achieves tactical
grade performances, while typical MEMS CVGs seldom exceed the rate grade performance
level, which is however satisfactory for most of the automotive and consumer electronics
applications.
Parameter
Rate grade Tactical grade Inertial grade
√
Angle Random Walk [ ◦/ hr]
> 0.5
0.5 ÷ 0.05
< 0.001
Bias drift [ ◦/ hr]
10 ÷ 1000
0.1 ÷ 10
< 0.01
Scale factor Accuracy [%]
0.1 ÷ 1
0.01 ÷ 0.1
< 0.001
Full Scale Range [ ◦/ s]
50 ÷ 1000
> 500
> 400
Max. Shock in 1 ms [ g s]
103
103 ÷ 104
103
Bandwidth, Hz
> 70
100
100
Table 1. Performance requirements for different classes of gyroscopes
MEMS Gyroscopes for Consumer and
Industrial Applications
MEMS Gyroscopes for Consumer and Industrial Applications
19
271
5. Benchmark tests for two commercial products
5.1 Invensense IDG-650 Dual-Axis Pitch & Roll MEMS Gyroscope
The Invensense IDG-650 (Invensense, 2010) is a dual-axis MEMS gyroscope consisting of two
independent out-of-plane resonating tuning fork CVGs (for pitch and roll axes) integrated
on the same silicon die.
The MEMS and CMOS integrated circuit (IC) are electrically
connected together through wafer level bonding, in such a way that the mechanical structure
is covered and hermetically sealed at the wafer level ( Nasiri-Fabrication - patent protected).
The hermetic sealing improves the sensor resistance to humidity, high temperature and
electromagnetic/radio frequency interferences (EMI/RFI). The sensor has selectable scale
factors and full scale ranges ( FS = ± 2000 ◦/ s for faster motions, or FS = ± 440 ◦/ s for slower motions). Both the output measurements are thermally compensated by an internal
compensation circuit, comprising an integrated onboard temperature
5.2 STMicroelectronics LPR530AL Dual-Axis Pitch & Roll MEMS Gyroscope
The STMicroelectronics LPR530AL (STMicroelectronics, 2010) is a dual-axis MEMS gyroscope
capable of measuring angular rates along pitch and roll axes. The mechanical sensing element
is a vibrating disk fabricated using STMicroelectronic’s proprietary surface micromachining
process called ThELMA ( Thick Epipoly Layer for Microactuators and Accelerometers).
The
mechanical element is obtained by etching a thicker polysilicon epitaxial layer ( ≈ 15 μm) grown on top of a sacrificial oxide layer ( ≈ 2 μm), which is removed at the end of the process (release step) by isotropic etching. A second wafer is bonded to the substrate with the purpose
of creating a protecting case for the micromechanical structure. The ThELMA micromachined
mechanical element and the CMOS controller are finally assembled together in the same
chip (hybrid solution: two chips in a single package) either in a side-by-side or a stacked
configuration.
STM LPR530AL IS IDG-500 IS IDG-650
• Scale factor
0.83
2
0.5
mV/ ◦/ s
• Scale factor ( × 4.5)
3.33
9.1
2.27
mV/ ◦/ s
• Scale factor calibration tolerance
5
6
6
%
• Scale factor calibration drift
0.034
0.067
0.067
%/ ◦C
over specified temperature (TA = 25 ◦)
• Full-scale
1200
500
2000
◦/ s
• Full-scale ( × 4.5)
300
110
440
◦/ s
• ZRO level
1.23
1.35
1.35
V
• ZRO tolerance
80
250
150
mV
• ZRO temperature sensitivity
0.083
0.417
0.667
◦/ s/ ◦C
over specified temperature (TA = 25 ◦ C)
• phase delay at 10 Hz
4.0
4.5
4.5
◦
• Turn-on time (typ)
200
50
50
ms
• Turn-on-time (max)
200
200
200
ms
• Total RMS noise
1.4
0.8
0.3
mV
• Nonlinearity
1
1
1
% of FS
• Cross-axis sensitivity
1
1
1
% of FS
• Supply voltage
2.7 ÷ 3.6
2.7 ÷ 3.3
2.7 ÷ 3.3
V
• Current absorption
6.8
7
7
mA
• Temperature range
− 40 ÷ 85
− 20 ÷ 85
− 20 ÷ 85
◦ C
• Package size
5 × 5 × 1.5
4 × 5 × 1.2 4 × 5 × 1.2
mm
Table 2. Specifications comparison for the gyroscopes under test
20
272
Will-be-set-by-IN-TECH
Microsensors
5.3 Comparative tests
The results of our comparative tests are briefly summarized in the following paragraphs.
Parts have been tested on a single-axis precision positioning and rate table (Aerosmith, 2005),
providing the desired angular rate profiles. An additional integral thermal chamber has been
installed on the table to allow thermal sensitivity/stress analyses.
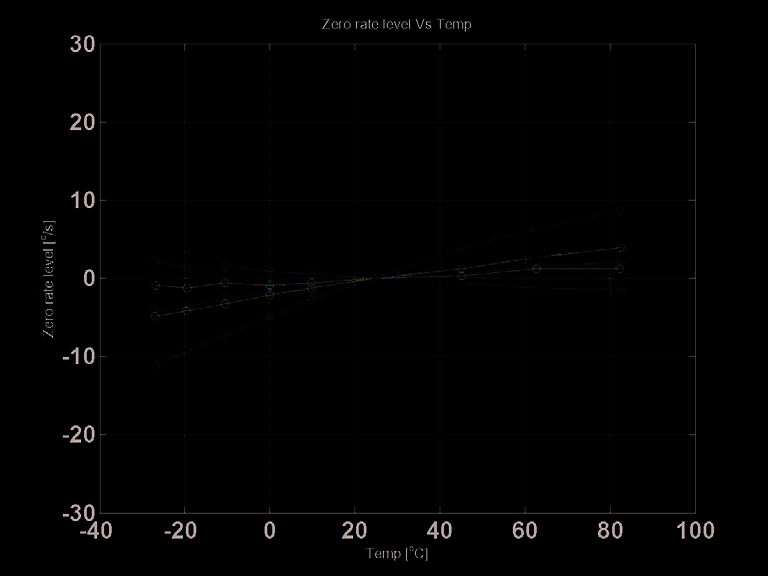
5.3.1 ZRO temperature sensitivity
The ZRO has been measured by setting the default FS (i.e. full-scale × 4.5 in Tab. 2) for both STM and IS sensors, and by varying the temperature over the range − 40 ◦ C ÷ 85 ◦ C in steps of 5 ◦ C. As shown in Fig. 11, the ZRO of the STM sensor appears to be slightly more insensitive
to temperature variations than the IS sensor; however, the temperature sensitivities of both
sensors are within specifications.
Fig. 11. ZRO temperature sensitivity test results: STM (left); IS (right).
5.3.2 ZRO mechanical stress sensitivity
The ZRO has been measured after applying different calibrated vertical loads on the sensor
package, by means of a load cell. It has been noted that only the STM sensor has a ZRO that is
immune to the applied mechanical stress; for what concerns the IS sensor, the ZRO variation
exceeds the value of 30 ◦/ s as the vertical load varies over the range 0 ÷ 4 kg (see Fig. 12).
Fig. 12. ZRO mechanical stress sensitivity test results: STM (left), IS (right).
MEMS Gyroscopes for Consumer and
Industrial Applications
MEMS Gyroscopes for Consumer and Industrial Applications
21
273
5.3.3 Scale factor temperature sensitivity
Scale factor measurements have been done at a constant angular rate of 150 ◦/ s, and by
varying the temperature over the range − 40 ◦ C ÷ 85 ◦ C in steps of 5 ◦ C. On average, both the STM and IS sensors exhibit a scale factor temperature sensitivity below 0.05 %/ ◦C and
thus within specifications (see Fig. 13) .
Fig. 13. Scale factor temperature sensitivity test results: STM (left); IS (right).
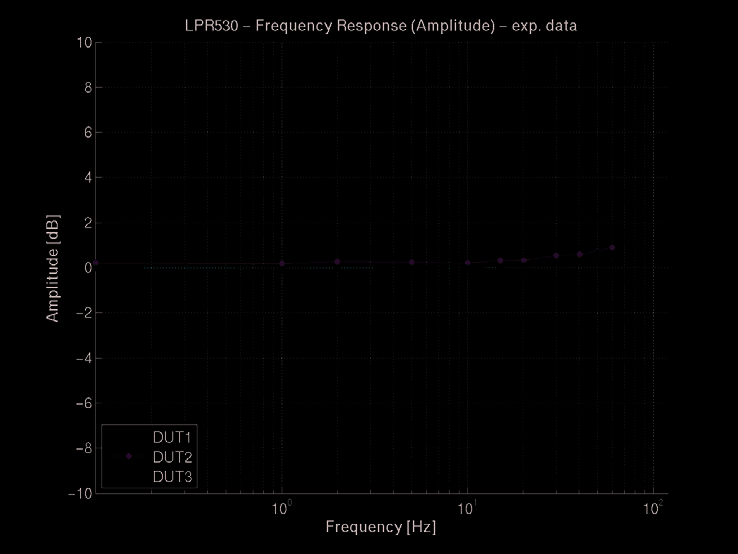
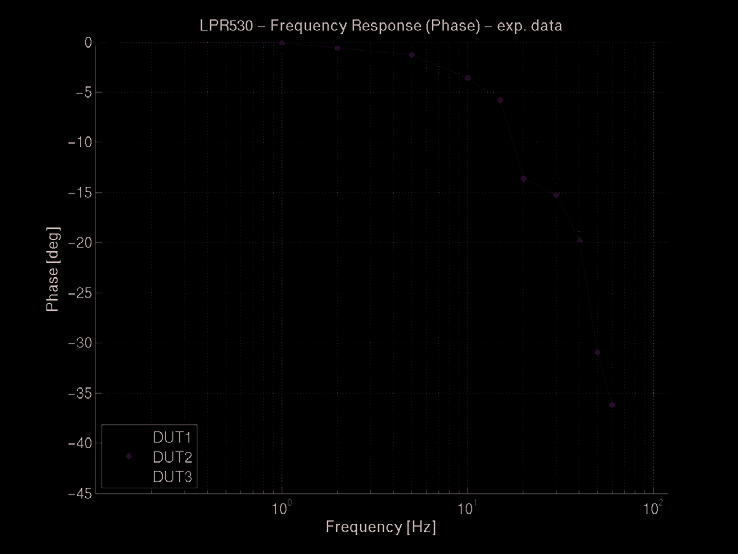
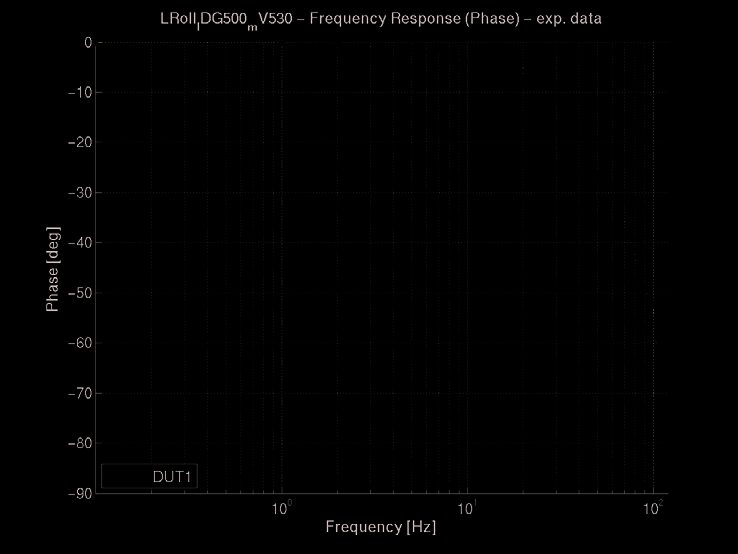
5.3.4 Frequency response
The sensor frequency response (from the angular rate input to sensor output measurement)
has been measured at 16 frequency points, almost regularly spaced in the frequency range
0.1 ÷ 100 Hz. Measurements have been carried out frequency-by-frequency, by evaluating the sensor magnitude and phase responses to an applied sinusoidal angular rate input. As it
can be observed in Figs. 14 and 15, the STM and IS sensors have almost identical frequency
responses, with a flat magnitude response up to 50 Hz and a phase lag of 45 ◦ at 80 Hz; the only noticeable difference consists of a flatter magnitude response of the STM sensor at higher
frequencies.
Fig. 14. STM LPR530AL measured frequency response: magnitude (left); phase (right).
22
274
Will-be-set-by-IN-TECH
Microsensors
Fig. 15. IS IDG-500/650 measured frequency response: magnitude (left); phase (right).
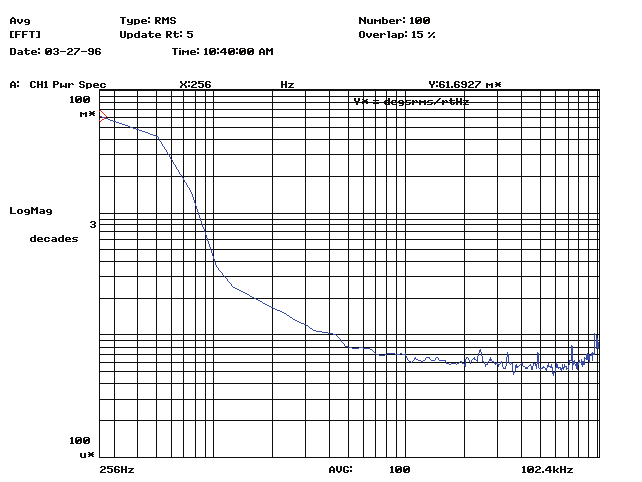
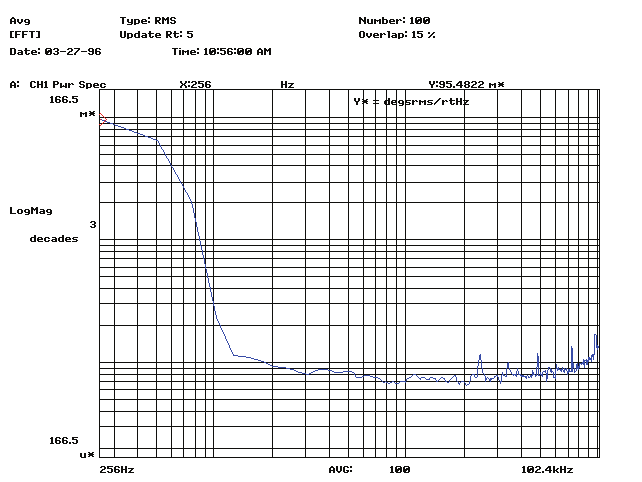
5.3.5 Noise power spectral density
The output noise Power Spectral Density (PSD) has been measured by using a Digital Signal
Analyzer (DSA). For a fair comparison, the full-scales of the two sensors have been selected
to be as matched as possible: therefore, the STM sensor FS has been set to 300 ◦/ s (scale factor
= 3.33 mV/ ◦/ s), while the IS sensor (IDG-500) FS has been selected as 500 ◦/ s (scale factor =
2 mV/ ◦/ s). With such configuration, the measured output noise floors of the two sensors are
√
√
almost identical, e.g. Sn = 0.035 ◦/ s/ Hz for the STM LPR530AL and Sn = 0.030 ◦/ s/ Hz for the IS IDG-500 (see also Fig. 16).
Fig. 16. Output noise power spectral density measurements: STM (left); IS (right).
6. Conclusions
In recent years, the development and commercialization of MEMS gyroscopes have
experienced a rapid growth, as a result of performance improvements and cost reductions.
Such sensors have begun to be applied in many consumer and industrial applications, either
to replace older, bulkier and more expensive angular rate sensors, or to become essential parts
in completely new applications requirin