CHAPTER 4
DATA ANALYSIS
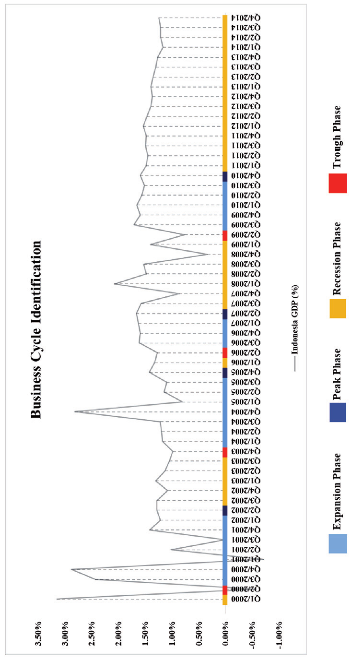
4.1. Business Cycle Identification
This section explains about business cycle classification from Q1/2000 to Q4/2014 by using indicators such as Indonesia real GDP growth rate, Indonesia inflation rate, and Jakarta Composite Index. The phases of business cycle are Recession, Trough, Expansion, and Peak.
4.1.1. Recession Phase
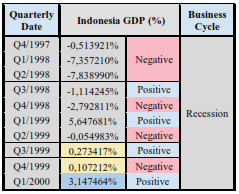
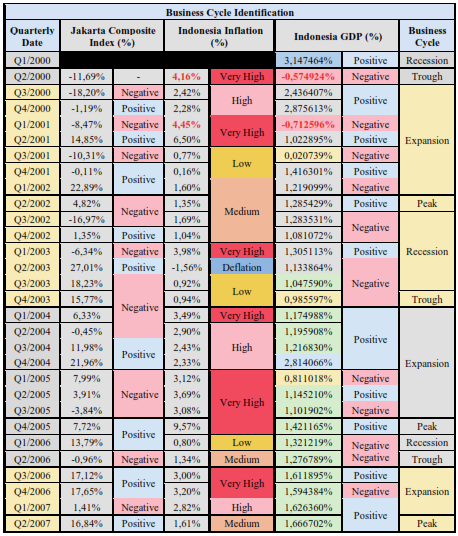
Due to the unavailability data of Jakarta Composite Index and Indonesia Inflation from Q4/1997 to Q1/2000, the business cycle phase can only be indicated through Indonesia GDP growth rate. Because there is negative Indonesia real GDP growth rate in period of Q4/1997-Q2/1998, this business cycle phase is categorized as recession.
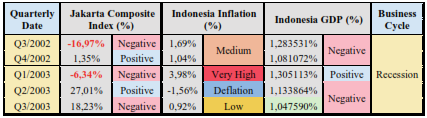
The business cycle phase from Q3/2002 to Q3/2003 is defined as recession because of negative Indonesia GDP growth in several years. It is also supported by significant negative Jakarta Composite Index in Q3/2002 and Q1/2003.
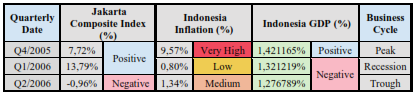
Q1/2006 is classified as recession phase since there is negative Indonesia GDP growth in two consecutive quarters of year (Q1/2006-Q2/2006) as well as very high Indonesia Inflation in the previous quarter (Q4/2005).
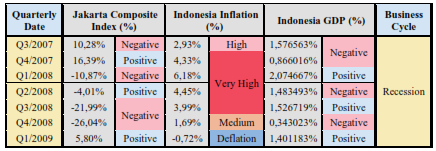
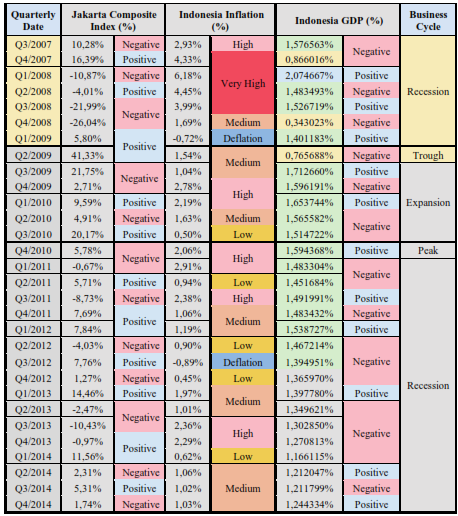
The period of Q3/2007-Q1/2009 is grouped as recession stage because of negative Indonesia GDP growth rate in several years. In addition, it is confirmed by high to very high Indonesia Inflation and negative Jakarta Composite Index.
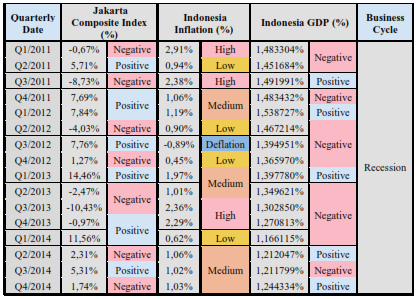
From Q1/2011 to Q4/2014, there are several indicators that explain recession phase such as negative Indonesia GDP growth, high Indonesia Inflation, and negative Jakarta Composite Index as we can see on the table above.
4.1.2. Trough Phase
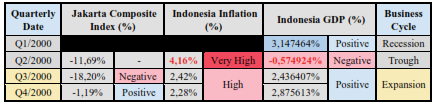
Trough phase in Q2/2000 is marked with significant negative Indonesia real GDP growth rate before starting expansion phase in the next quarters.
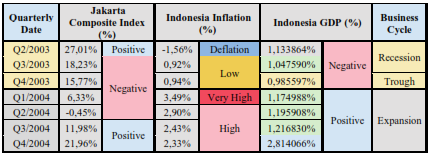
Although the Indonesia Inflation is low in Q4/2003, but negative Indonesia GDP growth and negative Jakarta Composite Index indicate trough before expansion phase in the next quarters.
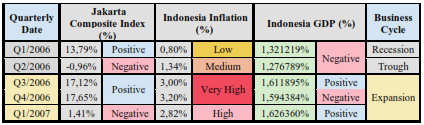
Trough phase in Q2/2006 is signed by negative Indonesia GDP growth rate, medium Indonesia Inflation, and negative Jakarta Composite Index.
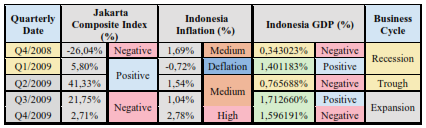
Even though the Jakarta Composite Index gives significant positive result in Q2/2009, the business cycle stage in this quarter is still defined as trough because of negative Indonesia GDP growth rate and medium Indonesia Inflation.
4.1.3. Expansion Phase
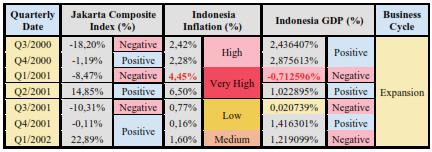
Although the Indonesia Inflation is high and the Jakarta Composite Index is negative in Q3/2000, the business cycle from Q3/2000 to Q1/2002 is categorized as expansion phase because of positive Indonesia GDP in two consecutive quarters (Q3/2000- Q4/2000).
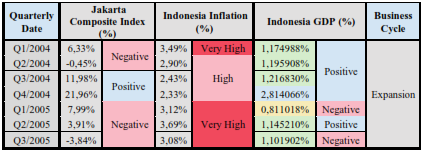
Although the Indonesia Inflation and Jakarta Composite Index do not give strong signal, the business cycle phase in period of Q1/2004-Q3/2005 is still categorized as expansion since there is positive Indonesia real GDP growth in four consecutive quarters of year.
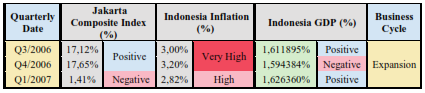
The business cycle in Q3/2006-Q1/2007 is considered as expansion phase because of consistent Indonesia GDP growth rate (the difference between each quarter is below than 0.05%) and significant positive Jakarta Composite Index in two consecutive quarters of year.
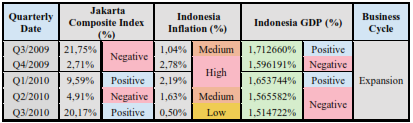
The business cycle in Q3/2009-Q4/2010 is identified as expansion phase because of several considerations such as steady Indonesia GDP growth rate, low-medium-high Indonesia Inflation, and high Jakarta Composite Index.
4.1.4. Peak Phase
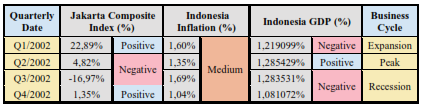
Peak phase in Q2/2002 is achieved by positive Indonesia GDP growth and medium Indonesia Inflation before starting recession phase in the next quarters.
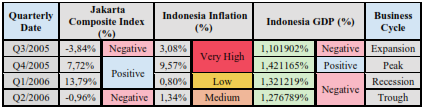
Although the Indonesia Inflation is very high in Q3/2005-Q4/2005, but positive Indonesia GDP growth rate and positive Jakarta Composite Index strongly indicate peak stage.
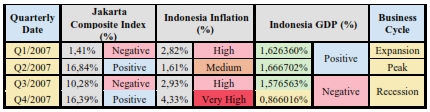
Peak phase in Q2/2007 is signed with positive Indonesia GDP growth, medium Indonesia Inflation, and significant positive Jakarta Composite Index before starting recession phase in the next period.
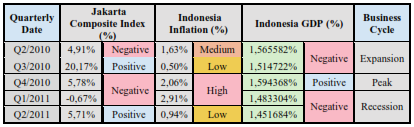
Even though the Jakarta Composite Index is negative and Indonesia Inflation is high, the business cycle stage in Q4/2010 is still defined as peak because of positive Indonesia GDP growth.
4.1.5. Business Cycle Identification Summary
The business cycle identification from Q1/2000 to Q4/2014 is listed below.
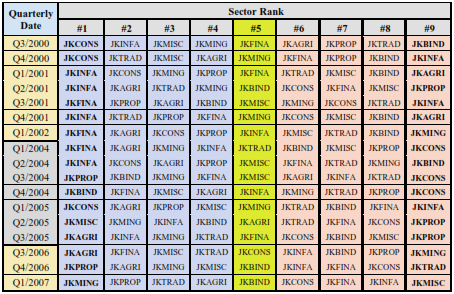
4.2. Sector Choice of Business Cycle
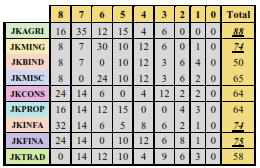
Previous studies proved that there are some sectors that perform better than the others in specified business cycle phase. In this section, the author summary the sectoral index performance analysis from Q1/2000 to Q4/2007 by comparing with Jakarta Composite Index. Then, the assessment analysis is conducted by scoring the rank position and chooses three best sectors to be picked out into portfolio.
4.2.1. Recession Phase
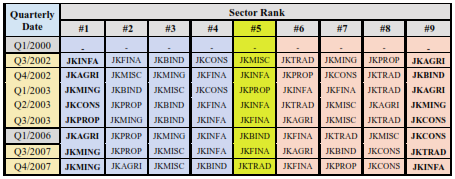
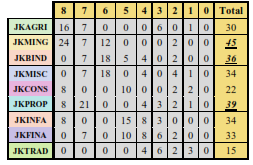
In the recession phase, three sectors which are better than the others are JKMING, JKPROP, and JKBIND. The investment portfolios that will be offered by this analysis are from Mining sector, Property sector, as well as Basic Industry and Chemicals sector.
4.2.2. Trough Phase
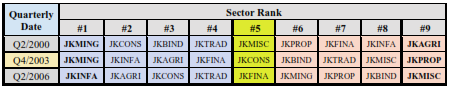
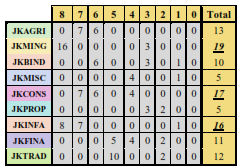
Based on selected trough phase, the author can conclude that top 3 sectors are JKMING, JKCONS, and JKINFA. As a result, the investment portfolio will be created from Mining sector, Consumer Goods Industry sector, and Infrastructure, Utilities & Transportation sector.
4.2.3. Expansion Phase
The first-three ranked sectors in expansion phase are achieved by JKAGRI, JKFINA, JKMING, and JKINFA.