5888.
Vorobyov, S. & Cichoki, A. (2002). Blind noise reduction for multisensory signals using ICA
and subspace filtering, with application to EEG analysis. Biological Cybernetics. Vol.
86, No. 4, April 2002, 293-303, ISSN 0340-1200.
Westbrook. G.L. (2000). Seizures and epilepsy. In: Principles of Neural Science. Kandel, E.R.,
Schwartz, J.H., and Jessel, T.M., Editors. Fourth edition., 910-935, McGraw Hill,
ISBN 0838577016.
Wolpaw, J.R.; Birbaumer, N.; McFarland, D.J.; Pfurtscheller, G. & Vaughan, T. (2002). Brain-
computer interfaces for communication and control. Clinical Neurophysiol ogy, Vol.
113, No. 6, June 2002, 767-791, ISSN 1388-2457.
Xu, B.; Song, A. & Wu, J. (2007). Algorithm of imagined left-right hand movement
classification based on wavelet transform and AR parameter model. Proceedings of
the International Conference on Bioinformatics and Biomedical Engineering ( ICBBE), pp.
539-542, ISBN 1-4244-1120-3, Wuhan, July 2007.
http://software.sci.utah.edu/map3d.
Texture Analysis Methods for Medical Image Characterisation
75
Texture Analysis Methods for Medical Image Characterisation
X
4
William Henry Nailon
Texture Analysis Methods for Medical
Image Characterisation
William Henry Nailon
Department of Oncology Physics, Edinburgh Cancer Centre & School of Engineering,
University of Edinburgh, United Kingdom
1. Introduction
Texture analysis refers to the branch of imaging science that is concerned with the
description of characteristic image properties by textural features. However, there is no
universally agreed-upon definition of what image texture is and in general different
researchers use different definitions depending upon the particular area of application
(Tuceryan & Jain, 1998). In this chapter texture is defined as the spatial variation of pixel
intensities, which is a definition that is widely used and accepted in the field. The main
image processing disciplines in which texture analysis techniques are used are classification,
segmentation and synthesis. In image classification the goal is to classify different images or
image regions into distinct groups (Pietikainen, 2000). Texture analysis methods are well
suited to this because they provide unique information on the texture, or spatial variation of
pixels, of the region where they are applied. In image segmentation problems the aim is to
establish boundaries between different image regions (Mirmehdi et al., 2008). By applying
texture analysis methods to an image, and determining the precise location where texture
feature values change significantly, boundaries between regions can be established.
Synthesising image texture is important in three-dimensional (3D) computer graphics
applications where the goal is to generate highly complex and realistic looking surfaces.
Fractals have proven to be a mathematically elegant means of generating textured surfaces
through the iteration of concise equations (Pentland, 1984). Conversely the ability to
accurately represent a textured surface by a concise set of fractal equations has led to
significant advances in image compression applications using fractal methods (Distani et al.,
2006)
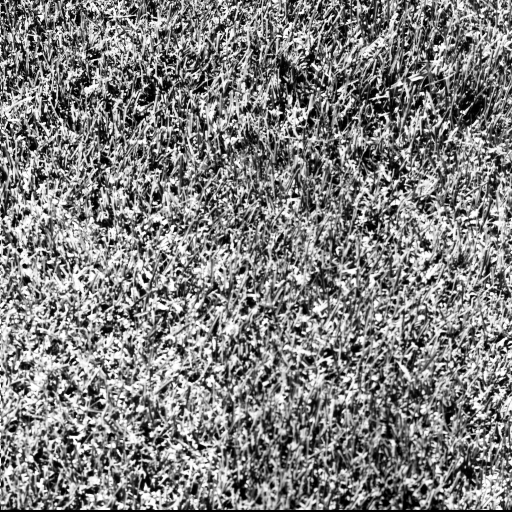
An example of image classification is presented in Fig. 1 in which it is possible to uniquely
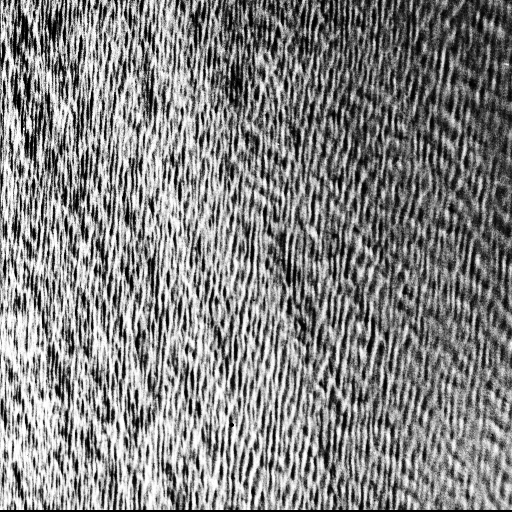
identify the two different textures (left, grass; right, water) by eye. In Fig. 2 the image on the
left is a composite image formed from eight Brodatz textures, all of which are represented in
approximately equal proportions. The right image is a grey-level texture map showing the
ideal segmentation of the textures (Weber, 2004).

76
Biomedical Imaging
vision against machine-based texture analysis approaches. Julesz, an experimental
psychologist, was an early pioneer in the visual perception of texture (Julesz, 1975). He was
responsible for establishing authoritative data on the performance of the human vision
system at discriminating certain classes of texture. He verified that discriminating between
two image textures depends largely upon the difference in the second-order statistics of the
textures. That is, for two textures with identical second-order statistics a deliberate amount
of effort is required to discriminate between them. In contrast little effort is required when
the second-order statistics of the textures are different. However, this observation does not
extend to textures that differ in third- or higher-order statistics, which are not readily
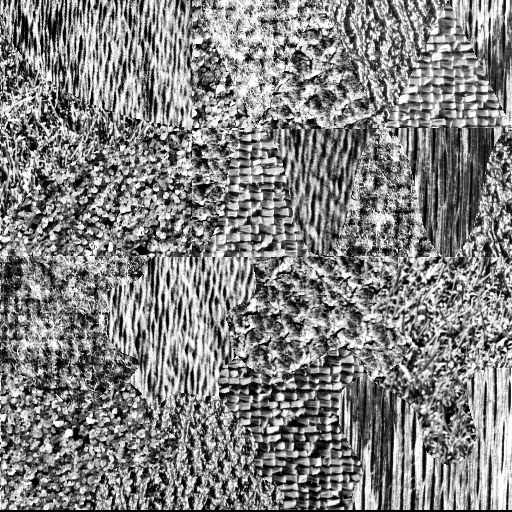
discriminated by eye (Julesz, 1975). This is illustrated in Fig. 3 in which each of the main
textured images (left and right) has a smaller area of similar, but subtly different, texture
embedded within it. In the image on the left both the main and embedded areas have
identical first-order statistics, however, their second-order statistics are different making it
straightforward to discriminate both regions. In the image on the right both textures have
identical first- and second-order statistics and therefore it is only after careful scrutiny that
the different textured regions become visible.
Fig. 1. Digital images of two visibly different textured regions extracted from the Brodatz
texture database (Brodatz, 1966). Left, image of grass (1.2.01, D9 H.E.). Right, image of water
(1.2.08, D38 H.E.) (Weber, 2004).
Fig. 3. The images on the left and right have a main area of texture embedded within which
is a smaller area of similar, but subtly different, texture. In the left image both textures have
the same first-order statistics and different second-order statistics, which makes it
Fig. 2. Example of image segmentation using texture analysis to determine the boundary
straightforward for an observer to distinguish between them. In the image on the right both
between distinct regions of texture. Left, mosaic image of eight Brodatz textures
textures have identical first- and second-order statistics and hence only after careful scrutiny
represented in approximately equal proportions. Right, grey-level texture map showing the
are the different patterns visible (Julesz, 1975).
ideal segmentation of the textures (Weber, 2004).
Although our understanding of the cognitive process of human vision is constantly
expanding much has been learned from experiments in the visual perception of digital
2. The Visual Perception of Texture
image information (Bruce et al, 2003). Such work is vital, particularly in medical imaging
Much of our understanding of machine vision algorithms is a result of attempts to overcome
where the misinterpretation of image information can have a serious impact on health
the failings of the human visual system to detect certain textured patterns. This
(ICRU, 1999). This is particularly apparent in radiotherapy, the treatment of cancer by
understanding has proven vital in evaluating and comparing the performance of human
ionising radiation, where the aim is to deliver as high a radiation dose as possible to


Texture Analysis Methods for Medical Image Characterisation
77
vision against machine-based texture analysis approaches. Julesz, an experimental
psychologist, was an early pioneer in the visual perception of texture (Julesz, 1975). He was
responsible for establishing authoritative data on the performance of the human vision
system at discriminating certain classes of texture. He verified that discriminating between
two image textures depends largely upon the difference in the second-order statistics of the
textures. That is, for two textures with identical second-order statistics a deliberate amount
of effort is required to discriminate between them. In contrast little effort is required when
the second-order statistics of the textures are different. However, this observation does not
extend to textures that differ in third- or higher-order statistics, which are not readily
discriminated by eye (Julesz, 1975). This is illustrated in Fig. 3 in which each of the main
textured images (left and right) has a smaller area of similar, but subtly different, texture
embedded within it. In the image on the left both the main and embedded areas have
identical first-order statistics, however, their second-order statistics are different making it
straightforward to discriminate both regions. In the image on the right both textures have
identical first- and second-order statistics and therefore it is only after careful scrutiny that
the different textured regions become visible.
Fig. 1. Digital images of two visibly different textured regions extracted from the Brodatz
texture database (Brodatz, 1966). Left, image of grass (1.2.01, D9 H.E.). Right, image of water
(1.2.08, D38 H.E.) (Weber, 2004).
Fig. 3. The images on the left and right have a main area of texture embedded within which
is a smaller area of similar, but subtly different, texture. In the left image both textures have
the same first-order statistics and different second-order statistics, which makes it
Fig. 2. Example of image segmentation using texture analysis to determine the boundary
straightforward for an observer to distinguish between them. In the image on the right both
between distinct regions of texture. Left, mosaic image of eight Brodatz textures
textures have identical first- and second-order statistics and hence only after careful scrutiny
represented in approximately equal proportions. Right, grey-level texture map showing the
are the different patterns visible (Julesz, 1975).
ideal segmentation of the textures (Weber, 2004).
Although our understanding of the cognitive process of human vision is constantly
expanding much has been learned from experiments in the visual perception of digital
2. The Visual Perception of Texture
image information (Bruce et al, 2003). Such work is vital, particularly in medical imaging
Much of our understanding of machine vision algorithms is a result of attempts to overcome
where the misinterpretation of image information can have a serious impact on health
the failings of the human visual system to detect certain textured patterns. This
(ICRU, 1999). This is particularly apparent in radiotherapy, the treatment of cancer by
understanding has proven vital in evaluating and comparing the performance of human
ionising radiation, where the aim is to deliver as high a radiation dose as possible to
78
Biomedical Imaging
diseased tissue whilst limiting the radiation dose to healthy tissue. Delineation of the
basis through volumetric data, however, it has been reported that with this approach
tumour volume is based primarily on visual assessment of computerised tomographic (CT)
information may be lost (Kovalev et al., 2001; Kurani et al., 2004). Findings reported by Xu et
and magnetic resonance (MR) image data by a radiation oncologist. Accurately defining the
al., on the use of 3D textural features for discriminating between smoking related lung
tumour, and potential areas of tumour involvement, on CT and MR data is a complex image
pathology, demonstrate the power of this approach for this particular application (Xu et al.,
interpretation process requiring considerable clinical experience. As a result significant
2006). Kovalev et al., showed that an extended 3D co-occurrence matrix approach can be
inter- and intra-clinician variability has been reported in the contouring of tumours of the
used for the classification and segmentation of diffuse brain lesions on MR image data
lung, prostate, brain and oesophagus (Weltens et al., 2001; Steenbakkers et al., 2005). This
(Kovalev et al., 2001). Texture analysis has also been used to identify unique pathology on
variability has been shown to be significant and heavily correlated with the digital imaging
multi-modality images of cancer patients. Using the local binary operator to analyse the
modality used and the image settings applied during the assessment.
weak underlying textures found in transrectal ultrasound images of the prostate, Kachouie
and Fieguth demonstrated that the approach was suitable for segmentation of the prostate
Texture analysis is presented here as a useful computational method for discriminating
(Kachouie & Fieguth, 2007). In another cancer-related study of 48 normal images and 58
between pathologically different regions on medical images because it has been proven to
cancer images of the colon, Esgiar et al., demonstrated that by adding a fractal feature to
perform better than human eyesight at discriminating certain classes of texture (Julesz,
traditional statistical features the sensitivity of the classification improved (Esgiar et al.,
1975). Section 3 presents statistical texture analysis through first-, second-, and higher-order
2002).
techniques. Section 4 considers the use of fractal methods for characterising image texture
through the box-counting and Korcak techniques. In section 5 methods are presented for
improving the overall efficiency of the texture analysis approach. These are feature
B
selection, reduction and classification. Section 6 presents two case studies, which
demonstrate the use of these approaches in practical biomedical imaging.
3. Statistical Approaches for Texture Analysis
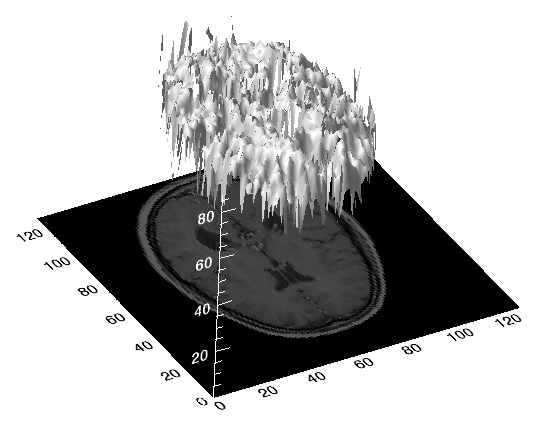
To examine an image using texture analysis the image is treated as a 3D textured surface.
This is illustrated in Fig. 4 which shows the textured intensity surface representation of a
A
two-dimensional (2D) medical image. In first-order statistical texture analysis, information
on texture is extracted from the histogram of image intensity. This approach measures the
frequency of a particular grey-level at a random image position and does not take into
account correlations, or co-occurrences, between pixels. In second-order statistical texture
analysis, information on texture is based on the probability of finding a pair of grey-levels at
Fig. 4. Three-dimensional textured intensity surface representation of a medical image. A:
random distances and orientations over an entire image. Extension to higher-order statistics
Two-dimensional MR image of the brain. B: Pixel values of the MR image plotted on the
involves increasing the number of variables studied.
vertical axis to produce a 3D textured surface.
Many conventional approaches used to study texture have concentrated on using 2D
With the proliferation of 3D medical image data of near isotropic quality there is an
techniques to compute features relating to image texture. This traditional approach has been
increasing demand for artificial intelligence methods capable of deriving quantitative
used extensively to describe different image textures by unique features and has found
measures relating to distinct pathology. The remaining sections of this chapter provide a
application in many disparate fields such as: discrimination of terrain from aerial
review of statistical and fractal texture analysis approaches in the context of medical
photographs (Conners & Harlow, 1980); in vitro classification of tissue from intravascular
imaging and provide comprehensive real-world examples, in the form of two case studies,
ultrasound (Nailon, 1997); identification of prion protein distribution in cases of Creutzfeld-
on the use of these approaches in clinical practice. In case study 1 texture analysis is
Jakob disease (CJD) (Nailon & Ironside, 2000); classification of pulmonary emphysema from
presented as a means of classifying distinct regions in cancer images, which could be
lung on high-resolution CT images (Uppaluri et al., 1997; Xu et al., 2004; Xu et al., 2006); and
developed further towards automatic classification. In case study 2 texture analysis is
identifying normal and cancerous pathology (Karahaliou et al., 2008, Zhou et al., 2007; Yu et
presented as an objective means of identifying the different patterns of prion protein found
a., 2009). Higher-order approaches have been used to localise thrombotic tissue in the aorta
in variant CJD (vCJD) and sporadic CJD. Two contrasting methods are presented in the case
(Podda, 2005) and to determine if functional vascular information found in dynamic MR
studies for evaluating the performance of the texture analysis methodologies.
sequences exists on anatomical MR sequences (Winzenrieth, 2006). Extension of these
approaches to 3D is continuing to develop within the machine vision community. Several
authors have reported the application of 2D texture analysis methods on a slice-by-slice
Texture Analysis Methods for Medical Image Characterisation
79
diseased tissue whilst limiting the radiation dose to healthy tissue. Delineation of the
basis through volumetric data, however, it has been reported that with this approach
tumour volume is based primarily on visual assessment of computerised tomographic (CT)
information may be lost (Kovalev et al., 2001; Kurani et al., 2004). Findings reported by Xu et
and magnetic resonance (MR) image data by a radiation oncologist. Accurately defining the
al., on the use of 3D textural features for discriminating between smoking related lung
tumour, and potential areas of tumour involvement, on CT and MR data is a complex image
pathology, demonstrate the power of this approach for this particular application (Xu et al.,
interpretation process requiring considerable clinical experience. As a result significant
2006). Kovalev et al., showed that an extended 3D co-occurrence matrix approach can be
inter- and intra-clinician variability has been reported in the contouring of tumours of the
used for the classification and segmentation of diffuse brain lesions on MR image data
lung, prostate, brain and oesophagus (Weltens et al., 2001; Steenbakkers et al., 2005). This
(Kovalev et al., 2001). Texture analysis has also been used to identify unique pathology on
variability has been shown to be significant and heavily correlated with the digital imaging
multi-modality images of cancer patients. Using the local binary operator to analyse the
modality used and the image settings applied during the assessment.
weak underlying textures found in transrectal ultrasound images of the prostate, Kachouie
and Fieguth demonstrated that the approach was suitable for segmentation of the prostate
Texture analysis is presented here as a useful computational method for discriminating
(Kachouie & Fieguth, 2007). In another cancer-related study of 48 normal images and 58
between pathologically different regions on medical images because it has been proven to
cancer images of the colon, Esgiar et al., demonstrated that by adding a fractal feature to
perform better than human eyesight at discriminating certain classes of texture (Julesz,
traditional statistical features the sensitivity of the classification improved (Esgiar et al.,
1975). Section 3 presents statistical texture analysis through first-, second-, and higher-order
2002).
techniques. Section 4 considers the use of fractal methods for characterising image texture
through the box-counting and Korcak techniques. In section 5 methods are presented for
improving the overall efficiency of the texture analysis approach. These are feature
B
selection, reduction and classification. Section 6 presents two case studies, which
demonstrate the use of these approaches in practical biomedical imaging.
3. Statistical Approaches for Texture Analysis
To examine an image using texture analysis the image is treated as a 3D textured surface.
This is illustrated in Fig. 4 which shows the textured intensity surface representation of a
A
two-dimensional (2D) medical image. In first-order statistical texture analysis, information
on texture is extracted from the histogram of image intensity. This approach measures the
frequency of a particular grey-level at a random image position and does not take into
account correlations, or co-occurrences, between pixels. In second-order statistical texture
analysis, information on texture is based on the probability of finding a pair of grey-levels at
Fig. 4. Three-dimensional textured intensity surface representation of a medical image. A:
random distances and orientations over an entire image. Extension to higher-order statistics
Two-dimensional MR image of the brain. B: Pixel values of the MR image plotted on the
involves increasing the number of variables studied.
vertical axis to produce a 3D textured surface.
Many conventional approaches used to study texture have concentrated on using 2D
With the proliferation of 3D medical image data of near isotropic quality there is an
techniques to compute features relating to image texture. This traditional approach has been
increasing demand for artificial intelligence methods capable of deriving quantitative
used extensively to describe different image textures by unique features and has found
measures relating to distinct pathology. The remaining sections of this chapter provide a
application in many disparate fields such as: discrimination of terrain from aerial
review of statistical and fractal texture analysis approaches in the context of medical
photographs (Conners & Harlow, 1980); in vitro classification of tissue from intravascular
imaging and provide comprehensive real-world examples, in the form of two case studies,
ultrasound (Nailon, 1997); identification of prion protein distribution in cases of Creutzfeld-
on the use of these approaches in clinical practice. In case study 1 texture analysis is
Jakob disease (CJD) (Nailon & Ironside, 2000); classification of pulmonary emphysema from
presented as a means of classifying distinct regions in cancer images, which could be
lung on high-resolution CT images (Uppaluri et al., 1997; Xu et al., 2004; Xu et al., 2006); and
developed further towards automatic classification. In case study 2 texture analysis is
identifying normal and cancerous pathology (Karahaliou et al., 2008, Zhou et al., 2007; Yu et
presented as an objective means of identifying the different patterns of prion protein found
a., 2009). Higher-order approaches have been used to localise thrombotic tissue in the aorta
in variant CJD (vCJD) and sporadic CJD. Two contrasting methods are presented in the case
(Podda, 2005) and to determine if functional vascular information found in dynamic MR