iam
D
#3
Measured X
Fig. 16 (a) and (d) show SS-OCT images of human finger in vivo taken using fiber probes #
20
Measured Y
eam
14 (working distance, depth of field and spot diameter of 1.2 mm 1.1 mm, and 27 m) and #
#1
Gaussian Fitted X
B
Gaussian Fitted Y
16 (working distance, depth of field and spot diameter of 0.9 mm 0.33 mm, and 16 m)
10
acquired by our catheter-based complex SS-OCT using our 3x3 Mach-Zehnder
0.0
0.5
1.0
1.5
2.0
interferometer with unbalanced differential detection technique with image size of 5x2mm.
Distance to Lens Surface (mm)
The image depth shown in Fig. 16 (a) is slightly larger than that in Fig. 16 (b), but the image
Fig. 15. Measured and Gaussian-fitted 1/e2 intensity beam diameters along the axial
is blurrier in Fig. 16 (a) than that in Fig. 16 (b), which taken by the probe with larger depth of
distance (zero is the position of the lens surface) at x (horizontal) and y (vertical) radial
field and spot size. The image shown in Fig. 16 (b) has higher resolution than that in Fig. 16
coordination in the distance range of depth of field of the samples #1, #3 and #8, which was
(a), which can be seen clearly with finer structures in layer of epidermis (grey arrow), sweat
made from the GRIN fiber lens. Insets: the cross-section beam profiles at three planes for the
gland (white arrow), and blood vessel in subcutis layer (black arrow).
sample #8.
For each curve in Fig. 15, the smallest beam diameter value presents the spot size, x-
coordinate value at the pole point indicates the working distance, and the distance range of
the curve indicates the depth of field. The working distance of 0.18 mm, depth of field of
0.16 mm, and spot size of 13 m were obtained for the sample #1 with 0.60 mm length of
100/140 GRIN fiber lens which was directly attached to SMF without fiber spacer. If the
length of GRIN fiber was reduced to 0.52 mm, the beam became less converged resulting the
(a)
(b)
three parameters increased slightly to 0.28 mm, 0.5 mm, and 22 m, respectively. When a
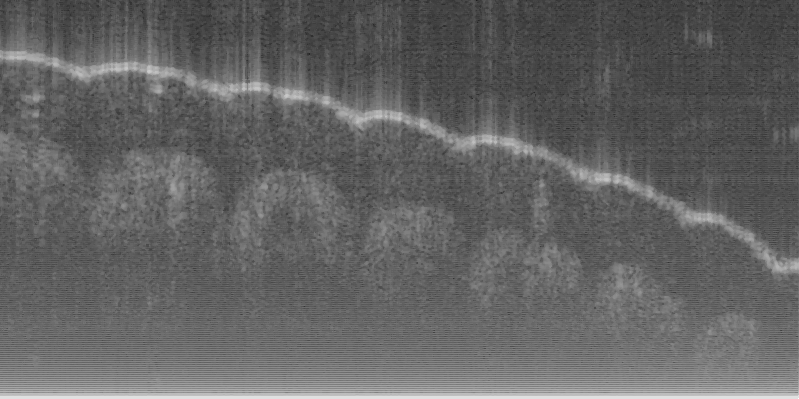
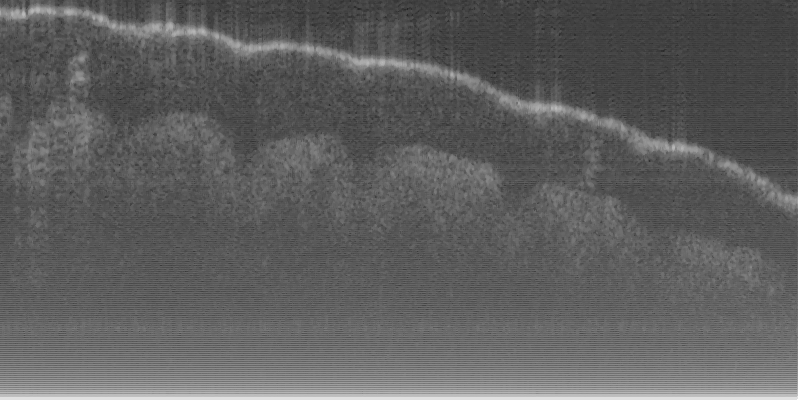
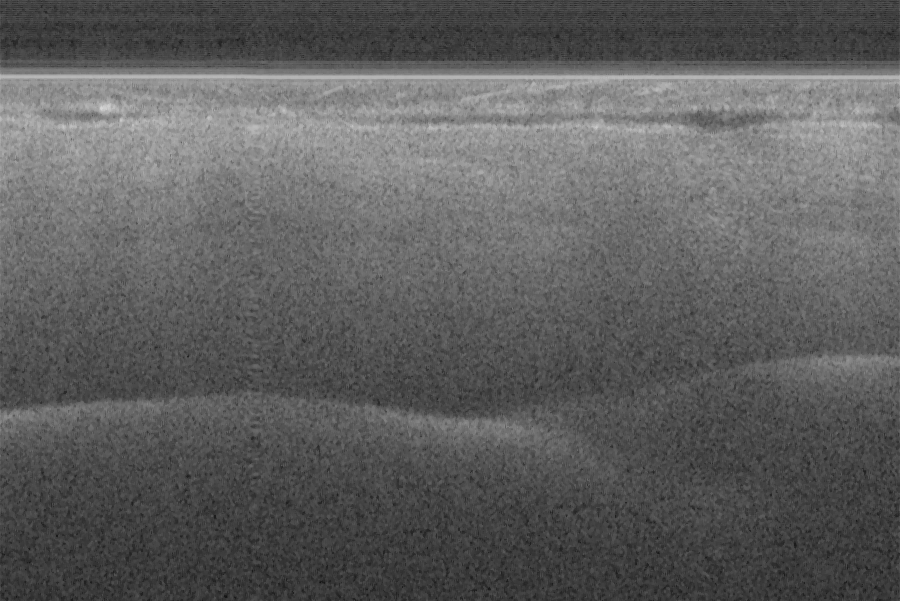
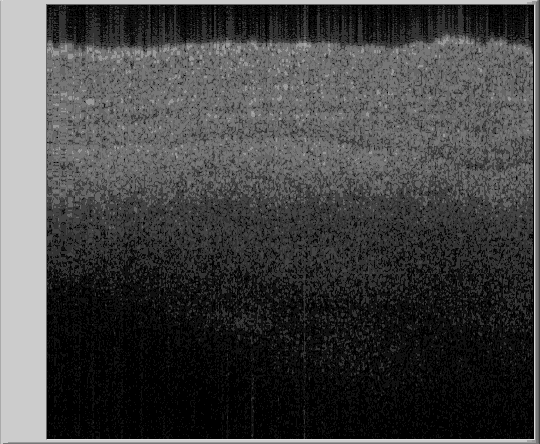
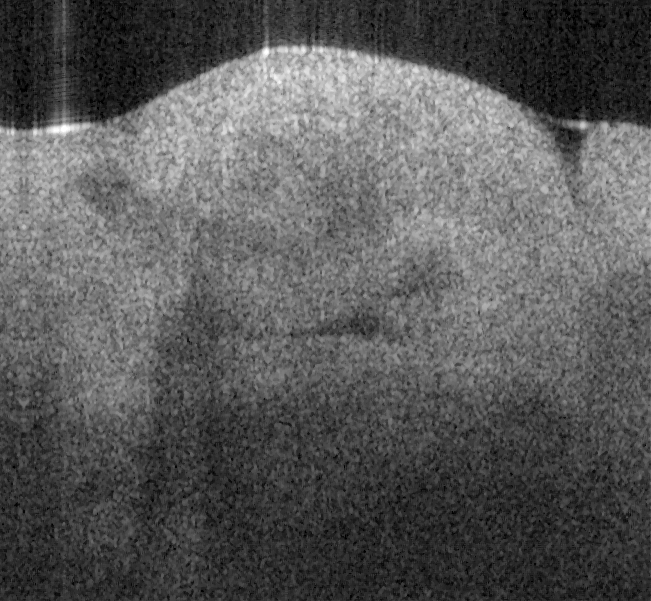
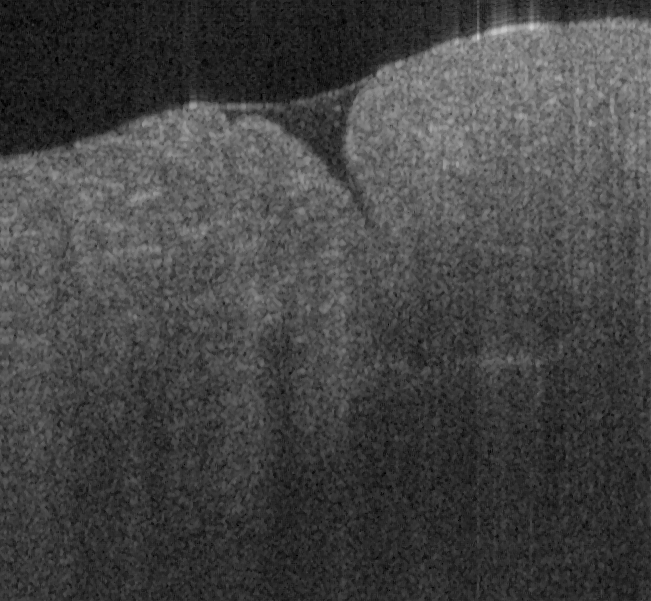
Fig. 16. In vivo human finger SS-OCT images taken with probe #14 (working distance, depth
0.48 mm fiber spacer was inserted between SMF and GRIN fiber and the length of GRIN
of field and spot diameter of 1.2 mm 1.1 mm, and 27 m) and # 16 (working distance, depth
fiber is reduced to 0.17 mm, significant less converged beam is observed. The working
of field and spot diameter of 0.9 mm 0.33 mm, and 16 m) acquired by our catheter-based
distance of 1.0 mm, depth of field of 0.95 mm, and spot size of 28 m were obtained for
complex SS-OCT using our 3x3 Mach-Zehnder interferometer with unbalanced differential
sample #8.
detection technique with image size of 5x2mm.
The measured beam diameters are well matched to Gaussian-fitted values in the center
Fig. 17 shows ex vivo images of coronary artery of rabbit with forward-view (a, b) probe with
(focused) regions, but have small deviations in the two edge side regions as shown in Fig. 15.
ball lens #16 and side-view (c, d) probe with GRIN lens #5 acquired by our catheter-based
The insets in Fig. 15 shown images of the cross-section beam profile at begin, center, and
complex SS-OCT using our 3x3 Mach-Zehnder interferometer with unbalanced differential
end planes, respectively, for the sample #8. The circular shapes of the profile images
detection technique with image size of 2.5x2mm by scanning the probe along the artery (a, c)
indicate high x and y symmetry of the beam profiles through all the range of depth of filed.
and scanning cross the artery (b, d). Three layers of tunica intima, tunica media, and tunica
adventitia for the coronary artery are viewed clearly as indicated by the gray, black, and
Considering chromatic aberrations, from ZEMAX simulation for the ball fiber lens in the
white arrows in all four images in Fig. 17. The fine layers of muscle and elastic fiber in the
wavelength range of 1260 – 1370 nm, the relative variations of the working distance, depth
tunica media of the coronary artery are shown obviously in the images obtained by
of field and spot size were calculated all smaller than 4.0%. For the GRIN fiber lens, the
scanning the probe cross the artery.
range of the zero-dispersion wavelengths, is 1297-1316 nm. The zero-dispersion slope, S
0
0,
equal to or smaller than 0.101 ps/nm2-km. Using the standard formula of fiber dispersion,
D() S
(ps/nm-km), we calculated the changes of refractive index in the
0[
4
0 / 3 ] / 4
1260 – 1370 nm wavelength range. By using these values in ZEMAX, we calculated the
Full Range Swept-Source Optical Coherence
Tomography with Ultra Small Fiber Probes for Biomedical Imaging
51
relative changes of the working distance, depth of field and spot size were all smaller than
3%. Based on our results, the desired beam profile for the application of optical biomedical
60
imaging systems can be obtained by the GRIN and ball fiber lens with or without fiber
) 50
spacers. The technique described here possesses a high degree of flexibility for designing
ultra-small optical probes with different beam shapes for the different tissue imaging.
40
eter (m
5. OCT Imaging
30
#8
iam
D
#3
Measured X
Fig. 16 (a) and (d) show SS-OCT images of human finger in vivo taken using fiber probes #
20
Measured Y
eam
14 (working distance, depth of field and spot diameter of 1.2 mm 1.1 mm, and 27 m) and #
#1
Gaussian Fitted X
B
Gaussian Fitted Y
16 (working distance, depth of field and spot diameter of 0.9 mm 0.33 mm, and 16 m)
10
acquired by our catheter-based complex SS-OCT using our 3x3 Mach-Zehnder
0.0
0.5
1.0
1.5
2.0
interferometer with unbalanced differential detection technique with image size of 5x2mm.
Distance to Lens Surface (mm)
The image depth shown in Fig. 16 (a) is slightly larger than that in Fig. 16 (b), but the image
Fig. 15. Measured and Gaussian-fitted 1/e2 intensity beam diameters along the axial
is blurrier in Fig. 16 (a) than that in Fig. 16 (b), which taken by the probe with larger depth of
distance (zero is the position of the lens surface) at x (horizontal) and y (vertical) radial
field and spot size. The image shown in Fig. 16 (b) has higher resolution than that in Fig. 16
coordination in the distance range of depth of field of the samples #1, #3 and #8, which was
(a), which can be seen clearly with finer structures in layer of epidermis (grey arrow), sweat
made from the GRIN fiber lens. Insets: the cross-section beam profiles at three planes for the
gland (white arrow), and blood vessel in subcutis layer (black arrow).
sample #8.
For each curve in Fig. 15, the smallest beam diameter value presents the spot size, x-
coordinate value at the pole point indicates the working distance, and the distance range of
the curve indicates the depth of field. The working distance of 0.18 mm, depth of field of
0.16 mm, and spot size of 13 m were obtained for the sample #1 with 0.60 mm length of
100/140 GRIN fiber lens which was directly attached to SMF without fiber spacer. If the
length of GRIN fiber was reduced to 0.52 mm, the beam became less converged resulting the
(a)
(b)
three parameters increased slightly to 0.28 mm, 0.5 mm, and 22 m, respectively. When a
Fig. 16. In vivo human finger SS-OCT images taken with probe #14 (working distance, depth
0.48 mm fiber spacer was inserted between SMF and GRIN fiber and the length of GRIN
of field and spot diameter of 1.2 mm 1.1 mm, and 27 m) and # 16 (working distance, depth
fiber is reduced to 0.17 mm, significant less converged beam is observed. The working
of field and spot diameter of 0.9 mm 0.33 mm, and 16 m) acquired by our catheter-based
distance of 1.0 mm, depth of field of 0.95 mm, and spot size of 28 m were obtained for
complex SS-OCT using our 3x3 Mach-Zehnder interferometer with unbalanced differential
sample #8.
detection technique with image size of 5x2mm.
The measured beam diameters are well matched to Gaussian-fitted values in the center
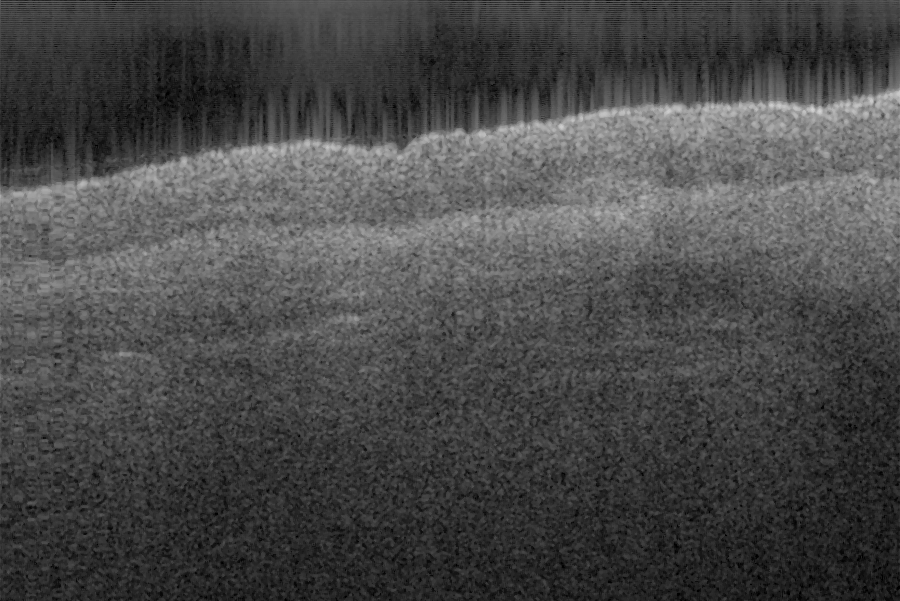
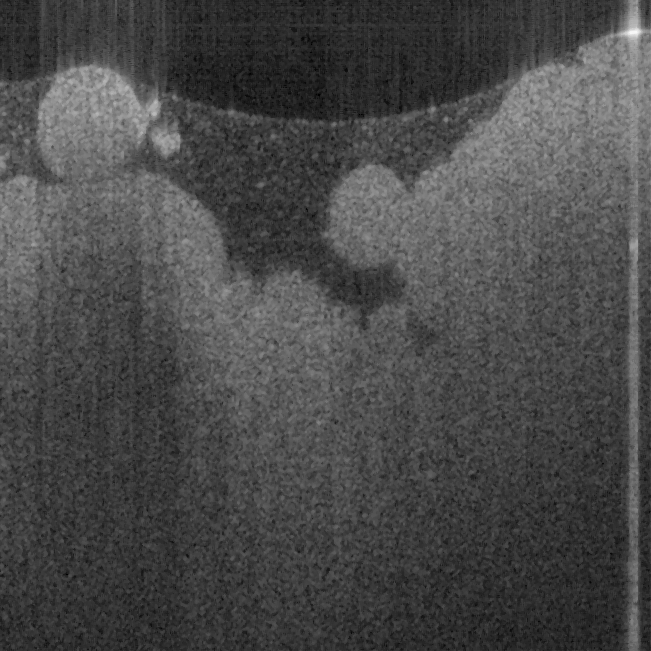
Fig. 17 shows ex vivo images of coronary artery of rabbit with forward-view (a, b) probe with
(focused) regions, but have small deviations in the two edge side regions as shown in Fig. 15.
ball lens #16 and side-view (c, d) probe with GRIN lens #5 acquired by our catheter-based
The insets in Fig. 15 shown images of the cross-section beam profile at begin, center, and
complex SS-OCT using our 3x3 Mach-Zehnder interferometer with unbalanced differential
end planes, respectively, for the sample #8. The circular shapes of the profile images
detection technique with image size of 2.5x2mm by scanning the probe along the artery (a, c)
indicate high x and y symmetry of the beam profiles through all the range of depth of filed.
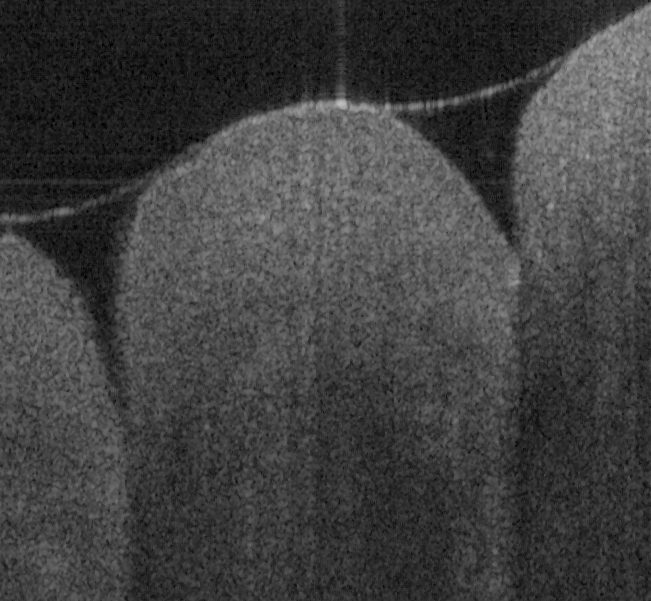
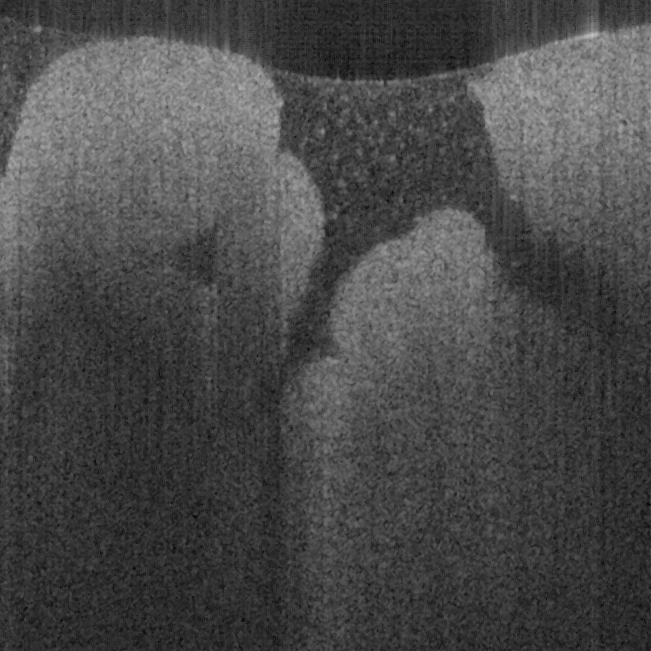
and scanning cross the artery (b, d). Three layers of tunica intima, tunica media, and tunica
adventitia for the coronary artery are viewed clearly as indicated by the gray, black, and
Considering chromatic aberrations, from ZEMAX simulation for the ball fiber lens in the
white arrows in all four images in Fig. 17. The fine layers of muscle and elastic fiber in the
wavelength range of 1260 – 1370 nm, the relative variations of the working distance, depth
tunica media of the coronary artery are shown obviously in the images obtained by
of field and spot size were calculated all smaller than 4.0%. For the GRIN fiber lens, the
scanning the probe cross the artery.
range of the zero-dispersion wavelengths, is 1297-1316 nm. The zero-dispersion slope, S
0
0,
equal to or smaller than 0.101 ps/nm2-km. Using the standard formula of fiber dispersion,
D() S
(ps/nm-km), we calculated the changes of refractive index in the
0[
4
0 / 3 ] / 4
1260 – 1370 nm wavelength range. By using these values in ZEMAX, we calculated the
52
Biomedical Imaging
(b)
(c)
(d)
6. Acknowledgments
Authors gratefully thank Dan P. Popescu and Michael G. Sowa from Institute for
Biodiagnostics of National Research Council of Canada, and Tim Cheung from Heart
Institute of University of Ottawa for their providing of the animal tissues.
(a)
(b)
(c)
(d)
Fig. 17. Ex vivo images of coronary artery of rabbit scanning along the artery (a, c) and
7. Conclusion
scanning cross the artery (b, d) with forward-view probe (a, b) with ball lens #16 and side-
view (c, d) probe with GRIN lens #5 acquired by our catheter-based complex SS-OCT using
We have demonstrated a catheter-based full range swept-source optical coherence
our 3x3 Mach-Zehnder interferometer with unbalanced differential detection technique.
tomography system. A 3x3 quadrature Mach-Zehnder interferometer with a new
unbalanced differential detection method for SS-OCT have been firstly presented. Using this
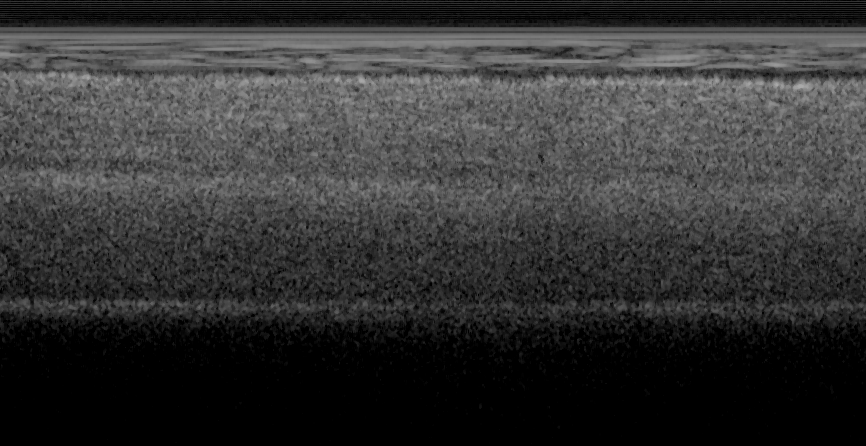
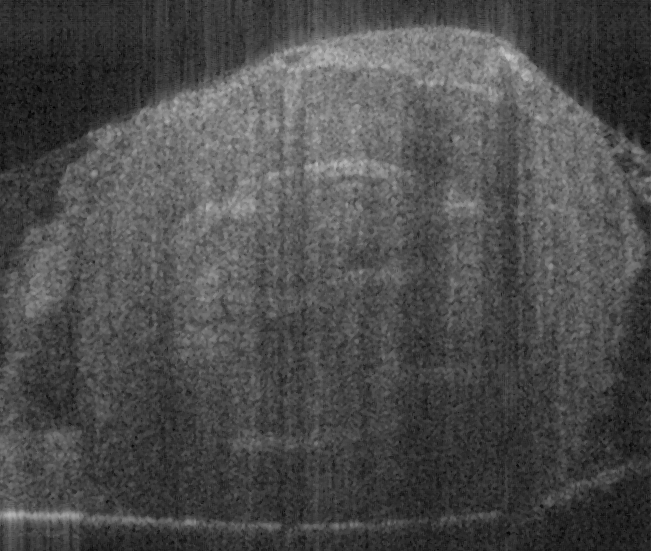
Fig. 18 shows ex vivo images of heart atrium (a, b), artery (c) of mice, and heart atrium (d, e, f)
setup, a complex conjugate artifact suppression of 27 dB has been achieved. A 90o phase
of pig with forward-view probe with ball lens #16 acquired by our catheter-based complex
shift between the two interferometric outputs was obtained thereby eliminating the need for
SS-OCT using our 3x3 Mach-Zehnder interferometer with unbalanced differential detection
further trigonometric calculations. Also, our setup resulted in a 4 dB increase in the signal-
technique with image size of 2x2mm. The shapes and structures of these internal organs of
to-noise ratio compared to a similar interferometer with the commonly used balanced
small and large animals are viewed clearly from these OCT images.
detection technique. We have then demonstrated a high-performance wavelength-swept
laser that uses a high-efficiency semiconductor optical amplifier, a high-speed polygon-
based narrowband scanning filter, and a Fourier domain mode lock technique. This laser
produced 71 mW average output power with an instantaneous linewidth of 0.09 nm, and it
could be tuned over a wavelength range of 113 nm at a repetition rate of 65.95 kHz. We also
constructed an OCT system that uses our laser source where we have shown that its
parameters are optimized for this application. We presented next the design, construction
and beam profile characterization of different variations of graded-index and ball fiber
lenses, which were recently proposed for ultra-small probes for OCT imaging. Those fiber
(a)
(b)
(c)
lens modules were made of single mode fibers and GRIN and ball fiber lenses with/without
fiber spacers between them. We used fusion-splicing in between the fibers, lenses and
spacers to ensure high quality light transmission. We found that beam-distance profiles (i.e.
0.4 - 1.2 mm of focus distance, 0.8 – 1.5 mm of depth of field, and 26 – 35 m of spot size) can
be obtained by precisely adjusting the lengths of the fiber spacer and the GRIN fiber lens or
diameter of the ball lens for the different tissue imaging in human beings and animals. We
obtained very high quality focused Gaussian beam profiles with high x and y symmetry
using the conventional multi-mode GRIN fibers and home-made fiber ball lenses. Their high
quality beam and ultra-small size make such fiber lens based probes very valuable for
(d)
(e)
(f)
biomedical optical imaging systems. The in vivo and ex vivo OCT images acquired by our
Fig. 18. Ex vivo images of heart atrium (a, b), artery (c) of mice, and heart atrium (d, e, f) of
catheter-based full range SS-OCT system indicate that this system is capable of imaging the
pig acquired by our catheter-based complex SS-OCT using our 3x3 Mach-Zehnder
biomedical tissues or inside organs for human, small/big animals and it is most suitable for
interferometer with unbalanced differential detection technique.
applications of diagnosis and guided surgery.
The in vivo and ex vivo OCT images shown in Fig. 16, 17, and 18 indicate that our catheter-
based complex SS-OCT system is capable of imaging the biomedical tissues or the inside
8. References
organs for human, small and big animals and it is most suitable for applications of diagnosis
Bilenca, A. et al. (2006). Numerical study of wavelength-swept semiconductor ring lasers:
and guided surgery.
the role of refractive-index nonlinearities in semiconductor optical amplifier and
implications for biomedical imaging application, Opt. Lett. 31, 760-762, ISSN: 0146-
9592.
Chinn, S.R.; Swanson, E. A. & Fujimoto, J. E. (1997). Optical coherence tomography using a
frequency-tunable optical source, Opt. Lett. , 22, 340-342, ISSN: 0146-9592.
Full Range Swept-Source Optical Coherence
Tomography with Ultra Small Fiber Probes for Biomedical Imaging
53
(b)
(c)
(d)
6. Acknowledgments
Authors gratefully thank Dan P. Popescu and Michael G. Sowa from Institute for
Biodiagnostics of National Research Council of Canada, and Tim Cheung from Heart
Institute of University of Ottawa for their providing of the animal tissues.
(a)
(b)
(c)
(d)
Fig. 17. Ex vivo images of coronary artery of rabbit scanning along the artery (a, c) and
7. Conclusion
scanning cross the artery (b, d) with forward-view probe (a, b) with ball lens #16 and side-
view (c, d) probe with GRIN lens #5 acquired by our catheter-based complex SS-OCT using
We have demonstrated a catheter-based full range swept-source optical coherence
our 3x3 Mach-Zehnder interferometer with unbalanced differential detection technique.
tomography system. A 3x3 quadrature Mach-Zehnder interferometer with a new
unbalanced differential detection method for SS-OCT have been firstly presented. Using this
Fig. 18 shows ex vivo images of heart atrium (a, b), artery (c) of mice, and heart atrium (d, e, f)
setup, a complex conjugate artifact suppression of 27 dB has been achieved. A 90o phase
of pig with forward-view probe with ball lens #16 acquired by our catheter-based complex
shift between the two interferometric outputs was obtained thereby eliminating the need for
SS-OCT using our 3x3 Mach-Zehnder interferometer with unbalanced differential detection
further trigonometric calculations. Also, our setup resulted in a 4 dB increase in the signal-
technique with image size of 2x2mm. The shapes and structures of these internal organs of
to-noise ratio compared to a similar interferometer with the commonly used balanced
small and large animals are viewed clearly from these OCT images.
detection technique. We have then demonstrated a high-performance wavelength-swept
laser that uses a high-efficiency semiconductor optical amplifier, a high-speed polygon-
based narrowband scanning filter, and a Fourier domain mode lock technique. This laser
produced 71 mW average output power with an instantaneous linewidth of 0.09 nm, and it
could be tuned over a wavelength range of 113 nm at a repetition rate of 65.95 kHz. We also
constructed an OCT system that uses our laser source where we have shown that its
parameters are optimized for this application. We presented next the design, construction
and beam profile characterization of different variations of graded-index and ball fiber
lenses, which were recently proposed for ultra-small probes for OCT imaging. Those fiber
(a)
(b)
(c)
lens modules were made of single mode fibers and GRIN and ball fiber lenses with/without
fiber spacers between them. We used fusion-splicing in between the fibers, lenses and
spacers to ensure high quality light transmission. We found that beam-distance profiles (i.e.
0.4 - 1.2 mm of focus distance, 0.8 – 1.5 mm of depth of field, and 26 – 35 m of spot size) can
be obtained by precisely adjusting the lengths of the fiber spacer and the GRIN fiber lens or
diameter of the ball lens for the different tissue imaging in human beings and animals. We
obtained very high quality focused Gaussian beam profiles with high x and y symmetry
using the conventional multi-mode GRIN fibers and home-made fiber ball lenses. Their high
quality beam and ultra-small size make such fiber lens based probes very valuable for
(d)
(e)
(f)
biomedical optical imaging systems. The in vivo and ex vivo OCT images acquired by our
Fig. 18. Ex vivo images of heart atrium (a, b), artery (c) of mice, and heart atrium (d, e, f) of
catheter-based full range SS-OCT system indicate that this system is capable of imaging the
pig acquired by our catheter-based complex SS-OCT using our 3x3 Mach-Zehnder
biomedical tissues or inside organs for human, small/big animals and it is most suitable for
interferometer with unbalanced differential detection technique.
applications of diagnosis and guided surgery.
The in vivo and ex vivo OCT images shown in Fig. 16, 17, and 18 indicate that our catheter-
based complex SS-OCT system is capable of imaging the biomedical tissues or the inside
8. References
organs for human, small and big animals and it is most suitable for applica