into nontoxic substances that can be eliminated from the body in urine and feces. In this way, the human body can take some toxic insult (at a dose
that is below the threshold) and still remain healthy.
The identification of the threshold beyond which the human body cannot
remain healthy depends on the type of response that is measured and can
vary depending on the individual being tested. Thresholds based on acute
responses, such as death, are more easily determined, while thresholds
for chemicals that cause cancer or other chronic responses are harder
to determine. Even so, it is important for toxicologists to identify a level of exposure to a chemical at which there is no effect and to determine
thresholds when possible.
Hypothetical Dose-Response Curve Showing Threshold
When a threshold is difficult to determine, toxicologists look at the slope of the dose-response curve to give them information about the toxicity
of a chemical. A sharp increase in the slope of the curve can suggest
increasingly higher risks of toxic responses as the dose increases, as
illustrated by line A on the next graph. A relatively flat slope suggests that the effect of an increase in dose is minimal (line B).
Two Hypothetical Dose-Response Curves with Different Slopes
65
Student Lesson 3
Chemicals, the Environment, and You
A comparison of dose-response curves among chemicals can offer
information about the chemicals as well. A steep curve that begins to climb even at a small dose suggests a chemical of high potency. The potency of a chemical is a measure of its strength as a poison compared with other
chemicals. The more potent the chemical, the less it takes to kill (Klassen, 2008). In the previous dose-response graph, line A describes a chemical that is more potent than the chemical described by line B, as can be seen by the relative positions of the lines along the dose axis and their slopes.
Although some dose-response tests use lethality as an index, toxicologists also make observations of responses that do not include death. Other
symptoms of toxic response to a chemical include fever, hair loss, headache, nausea, rash, urine abnormalities, and numbness in arms and legs.
Regardless of the response that is used for measurement with respect to
dose, toxicologists find that the form of the dose-response curve is similar.
Notes about Lesson 3
In this lesson, students will use the data they collected on the germination of their seeds in the presence of a chemical to create a dose-response curve for their chemical. In doing so, students will be able to compare visually the slope of their chemical’s curve with those of other students. Students also can compare the potency of the chemicals by measuring germination
of seeds. It is important for students to remember that they cannot make
inferences about the potency of the chemicals with respect to human
health; they can only use their data to inform them of the chemicals’
potential toxicity to humans. In this way, students must think critically and logically to make the relationships between evidence and explanations.
66
Web-Based Activities
In Advance
Activity 1 has an optional Web-based component.
Materials and Preparation
Photocopies and Transparencies
Extension Activity
1 transparency of Master 3.1
• overhead projector
1 copy of Master 3.2 for each team
• blank transparency
• overhead markers
For each team of 3 students:
• bags of seeds treated with
chemical from Lesson 2
(print version)
• materials for laboratory
investigation from Lesson 2,
Activity 2
For each student:
• Master 2.3, Toxicity Testing
on Seeds, from Lesson 2
• data from the Web site
(optional)
• 1 copy of Master 3.2
• pencil
Preparation
Activity 1
If your students conducted the Web version of Lesson 2, arrange for them to have access to computers.
Make a transparency of Master 3.1, Dose-Response Curves. Make copies of Master 3.2, Graph Paper, one for each team.
Extension Activity
Gather the materials needed for students to conduct their investigation.
67
Student Lesson 3
Chemicals, the Environment, and You
Procedure
ACTIVITY 1: Graphing the Response to Chemical Dose
If students are investigating seed germination using the Web
site, direct them to access the data on the site and proceed to
Step 3 of this activity (see Lesson 2, Activity 4).
1-p. As the students enter the room, ask them to get their bags of seeds treated with chemicals from Lesson 2 and bring them to their
team’s table.
2-p. Direct students to observe each of their six bags of seeds. Ask them to record in the Day 3 column of their data table the number of
seeds in each population that have germinated and the number of
seeds that have not germinated.
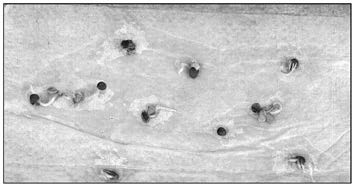
Students might see more than just germination: Some plants now
might be developing leaves. Encourage students to note any growth in
the margin of their data table.
3. Once students have completed their data table, tell them that
scientists graph data like theirs to help them understand the
relationship between dose and response and make judgments
about the safety of particular chemicals. Be sure to point out that
Content Standard A:
students can assume that the dose the seeds receive is related to the
Students use appropriate
concentration of the chemicals in each bag. Display the sample graphs
tools and techniques to
of dose-response relationships on the transparency of Master 3.1,
gather, analyze, and
Dose-Response Curves.
interpret data.
Point out to students that, in the top graph, the dose of alcohol is along the x-axis and the response is graded along the y-axis, from no effect to death. On the second graph, the dose of chemical in milligrams is
along the x-axis. The response, the incidence of tumors in a population of mice, is along the y-axis. Use the Background Information to provide information for students about the two types of dose-response curves:
for individuals and for a collection of subjects.
68
It might be of interest to your students to think about a word that
often describes a person who has had too much to drink: intoxicated.
Using their knowledge of toxicology, students should recognize that
the base of the word toxic accurately describes what happens when a person is drinking. A person who is drinking alcohol is exposing
himself or herself to a toxic substance that, at a high enough dose,
can cause death. Impress upon students that the dose-response
curve on the overhead provides evidence that binge drinking (which
provides a high dose of alcohol in a very short time) can be very
dangerous, and even deadly.
4. Tell students that you would like them to graph the data they
recorded for Day 3 of their seed investigation. Using a blank
transparency, work with students to design a graph that shows
the relationship between dose and response. To do that, students
will need to help you decide the following:
Content Standard A:
Students use mathematics
• Which of the two types of dose-response graphs will
in all aspects of scientific
they use?
inquiry.
Students will want to use the dose-response graph that represents
data from a population of individuals.
• What is the response that you want to graph?
This is sometimes counterintuitive for students. The response that
they want to graph is the one caused by the chemical (the response
that was different from the response of the control group). In most
cases, the response is the lack of germination, so students would
graph the number of seeds in the population that did not germinate.
• What measurement should be on the x-axis?
The dose is recorded along the x-axis, in increasing concentrations from 0% to 100%. Help students recognize that they need to space
their measurements accurately along the x-axis, but not at even
intervals since their concentrations are 0%, 6.25%, 12.5%, 25%, 50%,
and 100%.
• What measurement should be on the y-axis?
The response is recorded along the y-axis, as the number of seeds in the population that did not germinate, from 0 to 10.
69
Student Lesson 3
Chemicals, the Environment, and You
When you are finished making a sample of the graph, it should look like the following graph:
Dose-Reponse Curve for Seed Germination Investigation
Chemical:
d 10
9
8
7
6
NOT germinate 5
4
Response: seeds 3
of 2
1
0
Number
0 6.25 12.5
25
50
100
Dose (% Concentration)
5. Distribute copies of Master 3.2, Graph Paper, one to each team. Direct teams to make a dose-response graph for their chemical on Graph A.
Remind students to label their graph with the name of their chemical.
6. Once teams have made a graph of their chemical, instruct them to get data from two other teams that tested different chemicals. Tell teams
to graph the data on Graphs B and C, remembering to label each
graph with the name of the chemical.
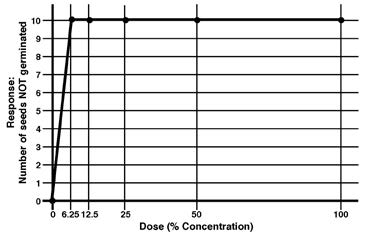
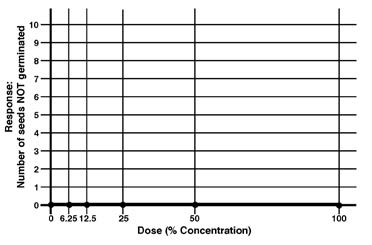
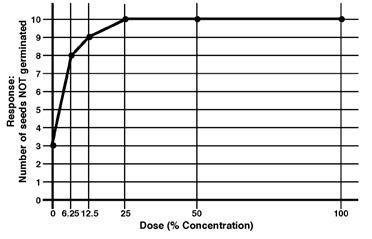
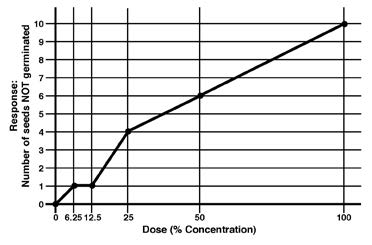
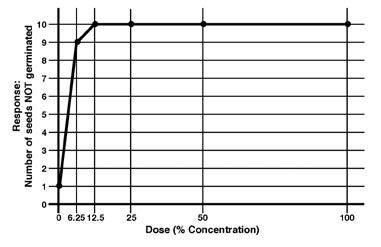
Tip from the field test: Included here are several dose-response graphs for chemicals tested by students who participated in the field test.
70
Chemical: Pine-Scented Cleaner
Chemical: Coffee
71
Student Lesson 3
Chemicals, the Environment, and You
Chemical: Insect Repellent
Chemical: Fruit Punch Soda
72
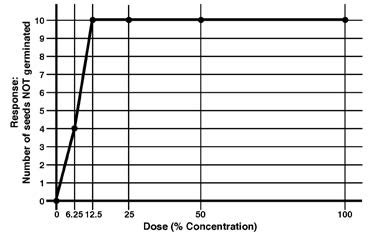
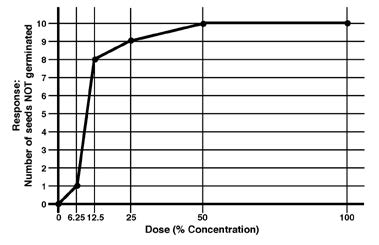
Chemical: Salt
Chemical: Window Cleaner
73
Student Lesson 3
Chemicals, the Environment, and You
Chemical: Water-Soluble Plant Fertilizer
7. Circulate around the room and, as they work, ask the teams to study the team graphs to decide which chemical had the highest potency or
which chemicals have a clear threshold.
Of the chemicals graphed above, Lysol (pine-scented cleaner) is the
Listen to students’
most potent and coffee is the least potent. Field-test students found
descriptions of the
that it was difficult to determine threshold. They knew only that they
dose-response
exceeded the threshold below which there was no effect when they
curves to see if they
used Lysol, salt, window cleaner, bug repellent, fruit punch soda, and
understand the
plant fertilizer. To pinpoint the exact threshold, students would need
concepts of threshold
to repeat their investigation using additional concentrations between
0% and 6.25%. When they tested coffee, students found no threshold:
and potency.
Coffee had no effect on seed germination, even at 100% concentration.
8. Discuss with students what conclusions they can make, if any, about the safety or potential harm of the chemicals tested for humans.
Ask students to evaluate the use of plants as a model system for
toxicology testing.
Students should recognize that plants do not have the same structure
Content Standard A:
as humans or other animals, so results from tests that determine
Students develop
toxicity to plants may not apply to humans. In fact, there are
descriptions, explanations,
chemicals that are toxic to plants that do not harm humans and,
predictions, and models
conversely, there are chemicals that do not harm plants but are
using evidence.
capable of harming animals like humans. For this reason, it is best to
Content Standard A:
test chemicals on systems that most closely resemble the human system
Students think critically
if knowledge about effects on humans is the goal. Even so, students may
and logically to make
recognize that data from toxicity tests on seeds could help inform them
the relationships between
of possible toxicants to humans.
evidence and explanations.
74
Toxicologists use to their advantage their understanding that it is
possible for some chemicals to cause injury to one kind of living matter
without harming another kind of living matter. By understanding
this biological phenomenon, scientists can, for example, help farmers
develop pesticides that are lethal to fungi or insects but do not harm
crops, or antibiotics that kill infectious bacteria (also living organisms) but have low toxicity in humans.
Ask students to describe other questions they would like to answer about Extension
the effects of their chemical on plants. Allow space and time for students Activity
to investigate their questions.
For example, students might want to know if their chemical has an
effect on the growth of plants. They can sprout seeds and then water the
seedlings with varying concentrations of chemical solutions. By setting up an investigation that can last a longer time, students can experiment with the concept of exposure over time. They can administer a small dose of
chemical repeatedly for many days and compare the responses to those in
plants that receive only one large dose of chemical.
75
Student Lesson 3
L E S S O N 4
Explain/Elaborate
Individual
Responses Can
Be Different
Overview
At a Glance
Students are aware after Lesson 3 that not all chemicals have the same effect on seed germination. In this lesson, students look at the variation among responses of seeds to the same dose of the same chemical. In reviewing
their seed investigation, students note that sometimes not all seeds in the same bag responded in the same way. Students then use information about
acetaminophen to learn more about dose and individual susceptibility. They learn that individual variability accounts for the different responses in the same types of organisms exposed to the same dose of a chemical. Students
conduct an investigation into their own susceptibility to caffeine and
compare individual responses.
Major Concepts
The variety of responses among organisms exposed to the same dose
of chemical is due to individual susceptibility. Dose and individual
susceptibility play roles in all situations involving chemicals, including those involving medicines and caffeine.
Objectives
After completing this lesson, students will
• understand that the variety of responses among seeds exposed to the
same dose of chemical is due to individual susceptibility and
• recognize that dose and individual susceptibility play roles in human
exposure to chemicals, such as drugs and caffeine.
77
Chemicals, the Environment, and You
Toxic Effects of Chemicals
Background
The human body is a complex organism. It responds to both external and
Information
internal conditions. For example, when the body gets too hot, it begins to cool itself by turning on its cooling system: sweat. When sensors in the
brain detect that the body has cooled enough, the brain turns off the
sweat glands.
Sometimes the body’s balance is upset by chemical agents that put stress
on different body functions. Some chemicals increase heart rate or
sweating. Others decrease the rate of breathing. A chemical can have a
wide-ranging effect, or it can cause a very limited change in a particular organ of the body. A chemical is toxic if the body’s response to it is an adverse one, such as headaches, nausea, rashes, convulsions, or death.
Chemicals vary widely in their toxic potential. The variation among chemicals is due to their chemical structure. A chemical’s structure determines
• how the chemical is metabolized,
• the rate at which it is absorbed, and
• how it is excreted.
Small differences in structure can cause big differences in toxicity
(Marczewski and Kamrin, 2000).
Individual Susceptibility
The effect of a chemical also depends on another set of variables.
Organisms will have various responses to chemical exposures because each
organism is unique. For example, if a population of people was exposed to the same amount of the same chemical, some people might have very severe
reactions to the chemical while others might have no reaction at all. Those with a severe reaction are considered more “susceptible” to the chemical.
Individual susceptibility varies but is influenced by age, gender, health status, genetics, and lifestyle.
Photos: Corel
78

Photos: Corel
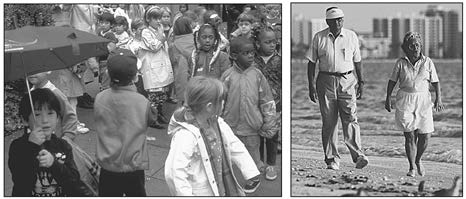
Children and elderly people often have an increased susceptibility to
chemicals. For example, children have higher rates of respiration and
consume more calories per unit of body weight than adults do. This can
result in a greater exposure to and dose of a chemical for children compared with adults. The metabolism of chemicals also can vary because children’s metabolic systems are still developing. In contrast, changes in physiologic functions, such as diminished kidney function, can impair the ability to
excrete chemicals in an elderly person.
Some people’s susceptibility is related to their overall health. People with asthma may be more susceptible to air pollution. Lifestyle factors such as smoking, drinking, and drug use may affect a person’s susceptibility to
toxicants. On the other hand, people with good nutrition and health are
more resilient, so they can metabolize and excrete toxic substances faster.
Chemicals sometimes affect males and females differently. For example,
women absorb and metabolize alcohol differently from men. Women will
generally have a higher blood alcohol concentration after ingesting the same amount of alcohol as men. While some of the difference in blood alcohol
concentration can be attributed to the difference in size between men and women, scientists have also found that women have less-active enzymes
that metabolize alcohol, causing a larger proportion of the ingested alcohol to reach the blood (NIAAA, 1997). When drinking heavily, women are
more susceptible to alcoholic liver disease, heart muscle damage, and brain damage. In addition, pregnant women can share an exposure to a chemical
with the fetus through the placenta, and women who are nursing may
expose their babies to the chemical through breast milk.
Inherited differences among people account for some of the different ways people respond to chemicals. For example, some people are genetically more susceptible to poisoning from the insecticide parathion. Most commonly,
people are exposed to parathion by eating foods grown with the use of the insecticide. Differences in individual reactions to the chemical depend on which of the two variants, or alleles, of a particular gene the individual carries. One variant results in low activity of the enzyme paraoxanase,
and one variant results in high activity of the enzyme. Scientists have
79
Student Lesson 4
Chemicals, the Environment, and You
determined that the
enzyme paraoxanase
breaks down parathion
into inactive, nontoxic
products that are
excreted in the urine.
Those people who
have the highly active
enzyme and are exposed
to parathion have mild
symptoms such as
abdominal discomfort,
vomiting, and diarrhea,
followed by headache and
weakness, because their
bodies are able to break
down the parathion
into nontoxic products
at a higher rate. Those
people with the gene that
results in low activity
of the enzyme can
have much more severe
symptoms when exposed
Courtesy of the Bayer Corporation
to the same amount of
parathion. These people may experience sudden collapse, coma, sweating,
and difficulty breathing because their bodies cannot break down parathion quickly and the chemical remains in the body for a longer time.
Understanding the variety of responses that different individuals
can have to different doses of a chemical is important to the study of
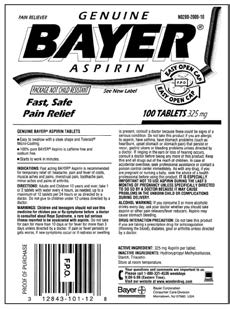
pharmaceuticals. Written on the label of any drug are indications describing who can use the drug and how much to take. In addition, warning
statements describe who should not use the drug. Such information is the
result of the knowledge scientists have gained about the way the chemical affects a diverse population over time.
The Chemical Caffeine
Caffeine is a chemical that most people ingest at some time in their
lives, and many people ingest caffeine daily. People consume caffeine in
coffee, tea, cocoa, chocolate, soft drinks, and some drugs.


