Lesson VII Market Structure
Reading Objectives:
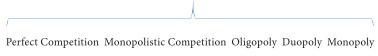
After reading this lesson the reader will understand that the economist meaning of market is something different from the common understanding of the market. In economics, the market is the study about the demand for and supply of a particular commodity and its consequent fixing of prices for instance the market may be a bullion market, stock market, or even food grains market. The market is broadly divided into two categories like perfect market and imperfect market. The perfect market is further divided into pure market (which is a myth) and perfect market. The imperfect market is divided into monopoly market, monopolistic market, oligopoly market and duopoly market. Based on the nature of competition and on the number of buyers and sellers operating in the market, the price for the commodity may be settled at the point where the demand forces and supply forces agree upon.
Lesson Outline:
Market is a place where people can buy and sell commodities. It may be vegetables market, fish market, financial markets or foreign exchange markets. In economic language market is a study about the demand for and supply of a particular item and its consequent fixing of prices, example bullion on market and foreign exchange market or a commodity market like food grains market etc. Market is classified into various types based on the characteristic features. They are classified on the basis of:
Area: family market, local, regional, national and international
Time: very short period, short period, long period, very long period
Commodity: produce exchange, bullion market, capital market, stock market
Nature of Transaction: spot market, forward market and futures market
Volume of business: whole sale market, retail market
Importance: primary market, secondary market, territory market
Regulation: regulated market, unregulated market
Economics: Perfect market and imperfect market Market In Economic Sense Implies:
Classification Of Market Structure Based On The Nature Of Competitor:
The imperfect market in turn can be classified as
The number and relative size of firms producing a good vary across industries. Market structures range from perfect competition to monopoly. Most real-world firms are along the continuum of imperfect competition. Market structure affects market outcomes, ie., the price and quantity of goods supplied.
Imperfect Competition
The above chart tells us that there are four types of imperfect competition existing in the present market environment. It is classified based on the number of buyers, sellers and competitors in the market. This chapter explains the price determination and profit maximization methods followed in these markets. Let us understand the meaning of each competition.
Monopoly market: a market with only one seller and a large number of buyers.
Monopolistic competition: a market in which firms can enter freely, each producing its own brand or version of a differentiated product.
Oligopoly market: market in which only a few firms compete with one another and entry by new firms is impeded/restricted.
Duopoly: market in which two firms compete with each other.
Monopsony: is a market with only one buyer, and a few/large sellers.
Perfect Market
Perfect competition is a market structure characterized by a complete absence of rivalry among the individual firms. A perfectly competitive firm is one whose output is so small in relation to market volume that its output decisions have no perceptible impact on price. No single producer or consumer can have control over the price or quantity of the product.
Characteristic features of perfect market:
In perfect market, the price of the commodity is determined based on the demand for and supply of the product in the market. The equilibrium price and output determination is as shown in the graph.
Graph - Price And Output Determination In The Perfect Market
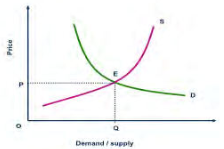
The demand curve (D) and the supply curve (S) intersect each other at a particular point which is called the equilibrium point. At the equilibrium point ‘E’ the quantity demanded and the quantity supplied are equal (that is OQ quantity of commodity is demanded and the same level is supplied etc). Based on the equilibrium the price of the commodity is fixed as OP. This is the fundamental pricing strategy followed in the perfect market.
Pricing Under Perfect Competition
Demand and supply curves can be used to analyze the equilibrium market price and the optimum output.
When the price at which quantity demanded is equal to quantity supplied, buyers as well as sellers are satisfied. If price is greater than the equilibrium price, some sellers would not be able to sell the commodity. So they would try to dispose the unsold stock at a lower price. Thus the price will go on declining till they get equalized (Qd = Qs). The various possible changes in Demand and supply are expressed in the following graphs to understand the price fluctuations in the market.
When the firm is producing its goods at the maximum level, the unit cost of production or managerial cost of the last item produced is the lowest. If the firm produces more than this, the managerial cost will rise. If that firm produces less than that level of output, it is not taking advantage of the economics of the large scale operation.When the firm produces largest level of output and sell at the managerial cost, it is said to be in equilibrium position.There is no temptation to produce more or produce less level of output. Likewise, when all the firms put together or the industry produces the largest amount of output at the lowest marginal cost, the industry is also said to be in the equilibrium
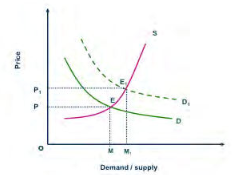
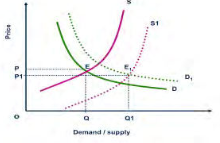
Let us assume that the demand equal to supply Q d = Q s and the equilibrium point ‘E’ determines the price as OP. In the short run the demand for the commodity increases but the supply remains the same. Then the demand curve shifts to the right and the new demand curve D 1 D 1 is derived. The demand has increased from OM quantity to OM 1. The new demand curve intersects the supply curve at the new equilibrium point ‘E 1’ and the price of the commodity is increased from OP to OP 1. Therefore it is clear that when demand increases without any change in supply this leads to price rise in the market.
Graph – Price And Quantity Variability When Increase In Demand
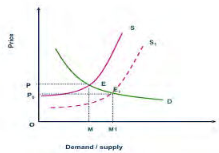
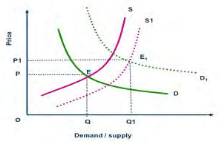
If the demand remains the same and the firm tries to supply more of the commodity, then the supply curve shifts from SS to S 1 S 1 (Graph – below). Earlier the equilibrium point was ‘E’ and the price of the commodity was OP. Due to change in supply the equilibrium point has changed into ‘E 1’ which in turn reduced the price form OP to OP 0. Therefore if the firm supplies more than the demand this leads to price fall in the market.
Graph – Price And Quantity Variability When Increase In Price
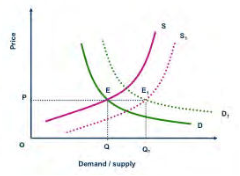
If the firm changes its supply due to increase in demand then the possible fluctuations in the price is explained below. Let us assume that the firm increased its supply 10% , the demand has also increased but not in the same proportion – it increased only 2% (  Qd < Qs). From the graph we can understand that the equilibrium point ‘E’ has changed into ‘E
 1 ’ which reduced the price of the commodity from OP to OP 1.
Graph – Price And Variability When Change In Demand Is Less Than Change In Supply
On the other hand when there is 10% increase in the demand and the supply has increased only to 2%, the new demand curve D 1 D 1 and the new supply curve S 1 S 1 intersect each other at the new equilibrium point ‘E 1. The price of the commodity is OP at ‘E’ and it increases from P to P 1 and becomes OP 1.i.e. When the demand increases more than the supply 1 ( Qd > Qs ) the price of the commodity will increase.
Graph – Price And Quantity Variability When Change In Demand Is More Than The Change In Supply
The following graph explains clearly that both the demand for the commodity and the supply increases in the same proportion (i.e. QD = QS).The shift in supply curve and the shift in demand curve are in the same level and the new equilibrium point ‘E 1’ determines the same price OP level. There is no change in the price when the demand and supply are equal.
Graph – Price And Quantity Variabilty When Change In Demand And Supply Equally
Profit Maximization Under Perfect Competition
The primary objective of any business is to maximize the profit. Profit can be increased either by increasing total revenue (TR) or by reducing the total cost (TC). The profit is nothing but the difference between the revenue and the cost.
The total profit = TR – TC
Let us assume that whatever produced is sold in the market.
TR = Quantity sold x price
To increase the revenue, it is better to either increase the quantity sold or increase the price. Therefore while increasing the revenue or minimizing the total cost of production over a period of time with attendant economies of scale will widen the difference to gain more profit.
In perfect market, the firm’s Marginal cost, Average cost, Average revenue, Marginal revenue are equal to the price of the commodity. The cost is measured as average cost and marginal cost .When the firm is in equilibrium, producing the maximum output i.e. cost of the last item produced is known as marginal cost.The total cost divided by the number of goods produced will give the average cost. When the firm is operating in perfect market MC = AC.
In the same way the revenue available to the firm through selling goods is called as total revenue.The last item sold is the marginal revenue. The total revenue divided by the number of items sold is the average revenue and when the firm is working in the perfect market the MR shall be equal to AR. Therefore the MC = MR = AR = AC = P in the short run. The size of the plant is fixed only with the variable factors and the price is fixed by the demand and supply.
Perfect Market Price Determination
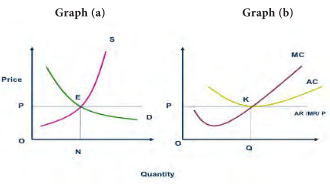
The demand for the commodity is expressed in the demand curve (D) and the supply (S) curve is known as S curve. The point of intersection of the D curve and S Curve is the equilibrium point (E) where the price is determined as OP. (Rs.10) The average revenue per unit is also Rs.10 expressed in graph (b) along with the marginal cost (MC) and average cost (AC) curves. The MC and AC intersect at point ‘K’ which is equal to the price OP AR MR. Therefore we can say that P=AR=AC=MR=MC at this level. At this equilibrium point buyers and sellers are satisfied with their price. The price of the commodity includes the normal profit through the average cost. The average cost consists of implicit and explicit costs. That means the organizers knowledge, time, idea and effort is also considered in the cost of production. Let us assume that in the short run the demand for the commodity increases, then the change in price and profit are explained in the graph below.
Graph - Short Run Profit Maximization Under Perfect Competition
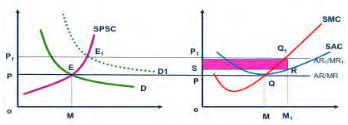
From the above graph we can understand that in the short run demand curve DD and the short period supply curve SPSC intersects at ‘E’ and the price of the commodity is determined as OP. The right side graph indicates the cost and revenue curves. The average revenue (AR) and marginal revenue (MR) are equal to the price of the commodity OP. The short period marginal cost (SMC) and short period average cost (SAC) are also depicted in the graph. The minimum average cost is selected based on the equilibrium point Q which produces optimum quantity of OM. The marginal cost curve and average cost curve intersects at the point Q that means QM amount (rupees) is spent as marginal as well as average cost.
The SAC is tangential to AR/MR at this point therefore we can conclude that the price of the commodity is equal to the average cost, average revenue, marginal cost and marginal revenue ( P = AR = MR = AC = MC )
If the demand increases in the market then the new demand curve D 1 D 1 intersects the SPSC at the new equilibrium point ‘E 1’ and the price increases from OP to OP1. Therefore the average revenue also increases from AR to AR 1. At this situation P 1 = AR 1 = MR but the SMC curve intersects at Q ie., new equilibrium point and the OM quantity has increased from OM to OM1 in the ‘X’ axis. The average cost has increased as M1R.
In the above graph, the shaded portion of P1Q1RS1 is the total profit earned by the firm in the short run but in the long run the organization will increase the production and will supply more of the commodity. Ultimately both the demand and the supply gets equalized and the short run abnormal profit becomes normal. Therefore we can conclude that even in the perfect market it is possible to earn profit in the short period.
It indicates clearly that in the short run, in any perfect market, the increase in demand will increase the profit to the businessmen. The normal profit will be there until it gets equalized with the demand i.e. new D1D1 with the increased supply of S1S1.
This economic profit attracts new firms into the industry and the entry of these new firms increases the industry supply. This increased supply pushes down the price. As price falls, all firms in the industry adjust their output levels in order to remain in profit maximizing equilibrium. New firms continue to enter the industry and price continues to fall, and existing firms continue to adjust their outputs until all economic profits are eliminated. There is no longer an incentive for the new firms to enter and the owners of all firms in the industry will earn only what they could make through their best alternatives.
Economic losses motivate some to exit (shut down) from the industry. The exit of these firms decreases industry supply. The reduction in supply pushes up market price and all the firms shall adjust their output in order to maximize their profit.
Shut Down Point:
If the market price for the product is below minimum average variable cost, the firm will cease to produce, if this appears to be not just a temporary phenomenon. When the price is less than average variable cost it will neither cover fixed cost nor a part of the variable costs. Then the firm can minimize losses up to total fixed costs only by not producing. It is therefore regarded as the shut down point.
In the short run, a firm can be in equilibrium at various levels depending upon different cost and market price conditions. But these are temporary equilibrium points. Thus at this unstable equilibrium point the firm gets excess profits or normal profit and sometimes incur loss also.
Consequences Of Pure Competition
Perfect competition ensures maximum welfare of the people as a whole. Each firm tends to attain the most efficient size to expand output and to reduce the average cost of production.
Lessons For Managers
Review Questions:
Exercise:
How will each of the following changes in demand and supply affect equilibrium price and equilibrium price and equilibrium quantity in a competitive market; that is, do price and quantity rise, fall or remain unchanged or are the answers indeterminate because they depend on the magnitude of the shift. Use supply and demand diagrams to verify your answers.
Mono means single, poly means seller and hence monopoly is a market structure where only one sells the goods and many buyers buy the same. Monopoly lies at the opposite extreme from perfect competition on the market structure continuum. A firm produces the entire supply of a particular good or service that has no close substitute.
Characteristic Features:
This does not mean that the monopoly firms are large in size. For example a doctor who has a clinic in a village has no other competitor in the village but in the town there may be more doctors. Therefore the barrier to the entry is due to economies of scale, economies of scope, cost complementarities, patents and other legal barriers.
Profit maximization under Monopoly Competition
For monopolist there are two options for maximizing the profit i.e. maximize the output and the limit the price or limit the production of the goods and services and fix a higher price (market driven price). In monopoly competition, the demand curve of the firm is identical to the market demand curve of that product. In monopoly the MR is always less than the price of the commodity.
Profit Maximization Rule:
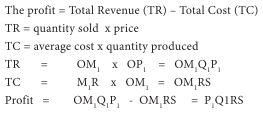
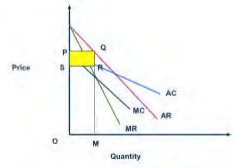
Produce at that rate of output where MR = MC. From the graph we can understand the profit maximization under monopoly. ‘X’ axis indicates the output and ‘Y’ the price/cost and revenue. The marginal revenue curve is denoted as MR. The average revenue curve is AR which is also the demand curve. MC is the marginal cost curve, It looks like a tick mark and average cost curve AC is boat shape.
Graph-Profit Maximization Under Monopoly Market
From the above graph it is seen that the demand curve D and average revenue curve AR are depicted as a single curve. The marginal revenue curve MR also slopes the same but the MR curve is below the AR curve. The short run marginal cost curve SMC looks like a tick mark and the boat shaped average cost curve SAC is also seen in the graph. The profit maximization criteria of MR=MC is followed in the monopoly market and the equilibrium point ‘E’ is derived from the intersection of MR and SMC curves in the short run. i.e. MC curve or SMC here intersects the MR curve from below. Based on the equilibrium point, the output is the optimum level of production i.e., at OM quantity. The price of the commodity is determined as OP. On an average the firm receives MQ amount as revenue. The total revenue of selling OM quantity gives OMQP amount of total revenue (OM quantity x OP price). The firm has spent MR as an average cost to produce OM quantity and the total cost of production is OMRS (OM quantity x MR cost per unit)
Profit = TR - TC
= OMQP - OMRS
= PQRS (the shaded portion in the graph)
In the short run the monopoly firm will earn profit continuously even with various returns.
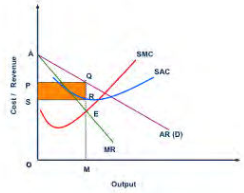
Graph-Monopoly Profit With Increasing Cost
From the above graph it can be understood that the cost of production (MC, AC) is increasing along with the output but even with the increasing scale the firm earns PQRS as profit which is the shaded portion in the graph.
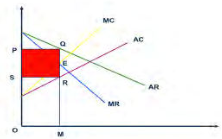
The graph given below explains clearly that the firms cost curves of Marginal cost (MC) and Average cost (AC) are declining with this slope. The organization earns PQRS profit but the profit is comparatively lesser than the previous situation.
Graph – Monopoly Profit Under Decreasing Cost
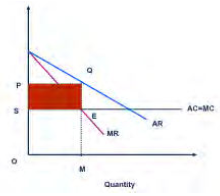
The third situation explains that the organizations’ marginal cost and average cost curves are horizontal and parallel to the X axis. Even with the constant scale, the firms earns profit as PQRS.
Graph – Monopoly Profit Under Constant Cost
Therefore we can conclude by saying that under monopoly market structure the firm will earn profit even under different cost conditions and profit maximization takes place. They follow the price determination condition as MC=MR and never incur loss.
Difference Between Perfect And Monopoly Market:
Lessons For Managers:
Review Questions:
The perfect competition and monopoly are the two extreme forms. To bridge the gap the concept of monopolistic competition was developed by Edward Chamberlin. It has both the elements like many small sellers and many small buyers. There is product differentiation. Therefore close substitutes are available and at the same time it is easy to enter and easy to exit from the market. Therefore it is possible to incur loss in this market. The profit maximization for each firm, for each product depends upon the differentiation and advertising expenditure. As every firm is acting as a monopoly the same logic of monopoly is followed. Each and every firm will have their own set of cost and revenue curves and the price determination is based on the rule of MR=MC and they incur varied profits according to their market structure. But in the monopolistic competition number of monopoly competitors will be there in different levels. They monopolize in a small geographical area or a segment or a model.
The demand curve of a monopolistically competitive firm would be more elastic than that of a purely monopolistic firm. The cost function of a firm would be that there will not be any significant difference across different types of structures in the product market. Given the function, and the corresponding AR and MR curves, and the cost function, and the corresponding SAC and SMC curves, the price and output determination of a profit – maximizing monopolistically competitive firm could be as follows.
Graph – Pricing Under Monopolistic Competition With Profit
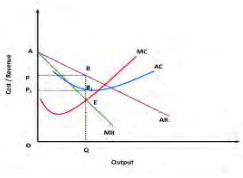
From the above graph we can understand that under monopolistic competition firms incur profit which is PP1 BB1 the pricing and profit dete