CHAPTER –IV
Lesson VIII Macro Economics
Introduction:
Macro economics is the study of aggregate economic behaviour of the economy as a whole. Macro economics deals with the output, (total volume of goods and services produced) levels of employment and unemployment, average prices of goods and services. It also deals with the economic growth of the country, trade relationship with other countries and the exchange values of the currency in the international market.
The major factors influencing these outcomes are international market forces like population growth, consumption behaviour of the country, external forces like, natural calamities, political instability and policy related changes such as tax policy, government expenditure (budget) money supply and various other economic policies of the country. Therefore it is essential to know the aggregate demand and aggregate supply of the country.
Aggregate demand: The total quantity of output demanded at prevailing price levels in a given time period, ceteris paribus.
Aggregate supply: The total quantity of the output the producers are willing and able to supply at prevailing price levels in a given time period.
These two summarizes the market activity of the economy. But the economy is disturbed by unemployment, inflation and business cycles. Various economic policies like Fiscal policy and monetary policy are followed by the government to achieve the equilibrium between aggregate demand and aggregate supply.
The following chapters will help us to understand the Macro Economic concepts, their behaviour and its impact on the economy. Thus, an understanding of macro economics and policies is of utmost importance to managers. Managers have to cope with the economic environment at two levels - firm level and macro level.
Objectives Of Economic Policies:
The major macro level economic policies framed by the government of India to achieve the objectives are:
The purpose of national income accounting is to obtain some measure of the performance of the aggregate economy. The major concepts used in the national income calculation are Gross Domestic Product (GDP), Gross National Product (GNP), Net National Product (NNP), personal income and Disposable income.
Gross Domestic Product is the total market value of all final goods and services currently produced within the domestic territory of a country in a year. It measures the market value of annual output of goods and services currently produced and counted only once to avoid double counting. It includes only final goods and services. It includes the value of goods and services produced within the domestic territory of a country by nationals and non nationals.
Gross National Product is the market value of all final goods and services produced in a year. GNP includes net factor income from abroad.
GNP = GDP + Net factor income from abroad (income received by Indian’s abroad – income paid to foreign nationals working in India)
Net National Product at market price is the market value of all final goods and services after providing for depreciation.
NNP = GNP – Depreciation
Depreciation means fall in the value of fixed capital due to wear and tear.
NNP at factor cost is called as National Income:
National income is the sum of the wages, rent, interest and profits paid to factors for their contribution to the production of goods and services in a year.
Nnp = Nnp (Market Price) – Indirect Tax + Subsidies Personal income (PI) is the sum of all incomes earned by all individuals / households during a given year. Certain incomes are received but not earned such as old age pension etc.,
Pi = Ni – Social Security Contribution – Corporate Income Tax – Undistributed Corporate Profits + Transfer Payments.
Disposable income is calculated by deducting the personal taxes like income tax, personal property tax from the personal income (PI).
Disposable Income = Personal Income – Personal Taxes = Consumption + Saving
Supernumerary income: the expenditure to meet necessary living costs deducted from disposable consumer income is called as supernumerary income.
The economy is divided into different sectors such as agriculture, fisheries, mining, construction, manufacturing, trade, transport, communication and other services. The gross production is found out by adding up the net values of all the production that has taken place in these sectors during a given year. This method helps to understand the importance of various sectors of the economy.
Approaches To Calculate National Income:
The Income Approach:
The income of individuals from employment and business, the profits of the firms and public sector earnings are taken into consideration.
National Income is the income of individuals + self employment + profits of firms and public corporate bodies + rent + interest (transfer payments, scholarships, pensions are not included) this includes the sum of the income earned by individuals from various input factors such as rent of land, wages and salaries of employees, interest on capital, profits of entrepreneurs and income of self employed people. This method indicates the income distribution among various income groups of people.
The Expenditure Approach:
In this approach national income is calculated by using the expenditure of individuals, private, government and foreign sectors. i.e. the sum of all the expenditure made on goods and services during a year. i.e.
National Income = Expenditure Of Individuals + Govt. + Private Firms + Foreigners
GDP = C + I + G + (X-M)
Where,
C = expenditure on consumer goods and services by individuals and households
I = expenditure by private business enterprises on capital goods
G = government expenditure on goods and services (government purchase)
X-M = exports - imports
The Output Approach:
In this approach we measure the value of output produced by firms and other organization in a particular time period. i.e. the National Income = income from agriculture + fishery + forestry + construction + transportation + manufacturing + tourism + water + energy …
Gdp At Market Price + Subsidies –Taxes
Gnp At Factor Cost + Net Income From Abroad
Factors Determining National Income:
Difficulties In The Calculation Of National Income:
Problems In Measuring National Income In India:
Uses Of National Income Estimates:
Difficulties Of Comparing National Income:
It is difficult to compare the national income of a country with others due to the difference in population size, working hours of labour force, currency values in the market, consumption pattern of general public, cultural difference and inflationary pressure of the country. Even with all the above mentioned difficulties the GDP is the major economic indicator of an economy.
National Income And Managers:
The managers of various organizations in different sectors follow the national income statistics to take managerial decisions at the firm level. Particularly national income data is useful for the marketing managers, financial managers, production managers, and advertising agents of any firm. The macro level policy makers will also use the data for their decision making. The following chapter provides the details regarding the major economic indicators of India.
Economic Indicators
The Indian economy is estimated to grow at 6.9 per cent in 2011-12, after having grown at the rate of 8.4 per cent in each of the two preceding years. This indicates a slowdown when compared to the previous two years but even during the period 2003 to 2011. Inflation as measured by the wholesale price index (WPI) was higher during most of the current fiscal year, though by the year end there was a clear slowdown. Food inflation, in particular, has come down to around zero, with most of the remaining WPI inflation being driven by non-food manufacturing products. Monetary policy was tightened by the Reserve Bank of India (RBI) during the year to control inflation and curb inflationary pressures. The slowing inflation reflects the lagged impact of actions taken by the RBI and the government. Reflecting the weak manufacturing activity and rising costs, revenues of the centre have remained less than anticipated; and, with higher than-budgeted expenditure, a slippage is expected on the fiscal side.
The global economic environment, which has been tenuous at best throughout the year, turned adversely in September 2011 owing to the turmoil in the Euro zone, and questions about the outlook on the US economy provoked by rating agencies. However, for the Indian economy, the outlook for growth and price stability at this juncture looks more promising. There are signs from some high frequency indicators that the weakness in economic activity has slowed down and a gradual upswing is imminent. The key economic indicators of India for the year 2011-12 are given in the table below.
Table – Key Economic Indicators Of India 2011-2012
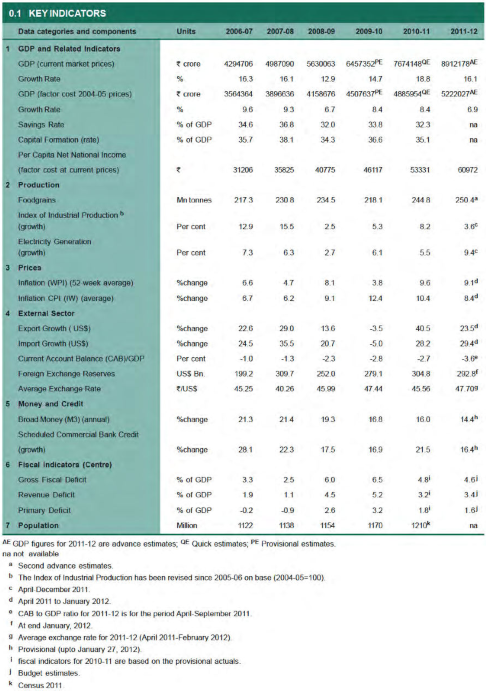
Table – Ratio’s Of Savings And Investment To Gdp (At Current Market Price %)
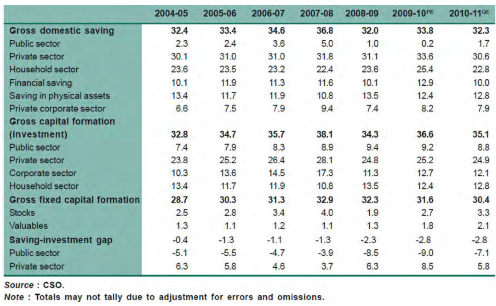
The major national savings and investments are shown in the above table. In the past five years public sector savings reduced and on other hand its investment has grown. Household’s saving and investment has come down.
Trend in Sectoral Composition of GDP
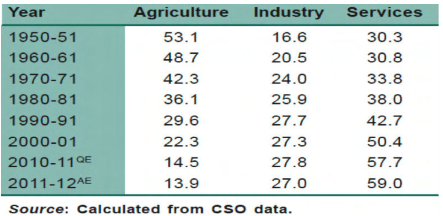
The sectoral contribution of GDP shows that in the 1950s agricultural sector’s contribution was around 53% but now it has come down to 14% . After opening up our economy the service sectors contribution has grown tremendously and it has reached 60%. Industrial growth of our country is very slow with an increase from 16% in 1950 to 27% in 2012.
Graph - Gdp Growth Estimates And Projection
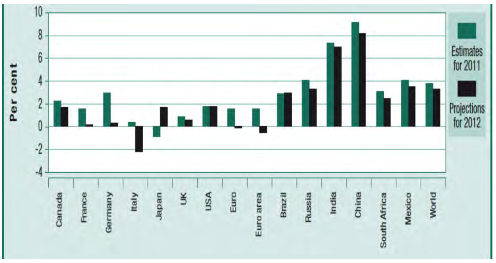
The GDP growth estimates of various countries are given in the above graph. It is found that China’s growth rate is nearly 10% followed by India with 7%. Italy and Euro areas have negative growth. It indicates that Asian countries are growing at a faster rate than the Western countries.
Share Of World Gdp
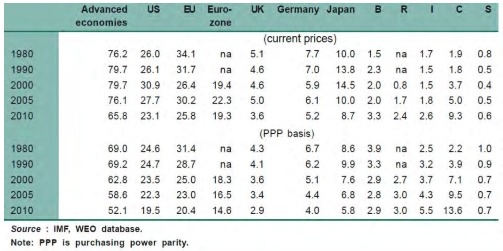
From the above table we can understand that the share of advanced economies in the world GDP is declining. It has reduced from 76% to 66%. whereas in the case of India, it has increased from 1.7% to 2.6%. From this we can conclude that Indian economy is growing and it is expressed in the various economic activities of our country. The major economic indicators are growing at a faster rate. The service sector’s contribution towards the economic development of our country is very high, due to this change the employment opportunities created by this sector has also grown at a faster rate. This is discussed in the following chapters.
Review Questions:
*****