Appendix A--Be all that you can be
Most of this book is about the best things to DO in the pursuit of new projects. This appendix is about the best things to BE and how to become them. Many observations are offered about the quality and the capabilities of the pursuit and project teams, because they are the ones whose performance will largely determine whether the project is successful. Also offered are example implementations that can be used as templates for organizing project activities.
These are the major topics covered in this appendix.
Developing better processes
The project plan for a new project typically includes estimates of cost and duration based on historical experience. If the historical experience includes waste (and it typically does), then some percentage of waste is automatically built into the estimate for the new project. More likely than not, the waste built into the estimates will recur in the current project if steps are not taken to eliminate or reduce it. Waste forces up the bid amount, reducing win probability if competitors have better processes. That is the best argument for having efficient processes.
Estimates based on history don’t reveal to us the amount of waste they contain. There is hardly ever a metric of how much waste can be eliminated. A waste reduction effort, like a risk mitigation effort, must begin with discovery.
Waste elimination may or may not directly reduce risk, but it reduces the base to which risk is applied. The expected impact of risk may thereby be reduced, and the probability of project success may be improved.
The modern tool of choice for waste reduction is called process management, process re-engineering, and various other names. Several schemes for process management have achieved recent fame, including “Six Sigma,” and the more recent Capability Maturity Models Integration (CMMI) developed by Carnegie Mellon University’s Software Engineering Institute (with input from others) for the U.S. Department of Defense.
The modern trend is continuous or at least stepwise improvement of processes. Process improvement is necessary if your competitors are doing it, and many of them are. For example, in the software development industry, many companies are in the process of raising themselves to higher CMMI levels. The CMMI approach calls for improvement over six levels (0-5) ranging from chaotic, with no processes, or poorly defined and executed ones, to “optimizing,” where processes are well established, documented, rigorously used, and improved at every opportunity.
Process management is a tool for reducing waste in business operations. Waste in U.S. companies has been estimated to be on the order of at least a trillion dollars a year, with waste in government perhaps half or more of that. Many advocates of smaller government would claim it is much higher. Some of this waste can never be eliminated, but experience shows that with effort much of it can be.
Unfortunately, waste is often blindly accepted until someone notices and points it out. Some common wasteful situations are:
Can we identify specific root causes of waste? If we could, we might be better prepared to foreclose wasteful situations before they occur—catch them early, and eliminate them before they take root and grow. Here are some root causes which have been cited by various authorities.
Waste elimination is not a one-time process. A project completely purged of waste (even if that were possible) eventually will pick up wasteful habits absent constant vigilance.
Much of waste is due to that seemingly inevitable product of bureaucracy, i.e., in either industry or government the development of functions and policies for the benefit or convenience of incumbent groups, usually associated with erection of barriers or "walls" that separate various functions from each other. The bureaucracies become isolated and fail to recognize what happens to a product or service outside their domain. The result is waste.
Conventionally, a project is viewed as a set of organizations performing certain functions aimed at particular goals. In this view, the project is the totality of the organizations and their functions. While it is possible for organizations acting individually to find and eliminate waste within their own boundaries, waste that occurs across organizational interfaces is substantial, and is more difficult to find and eliminate. To attack this waste, it is useful to view the project in a bit different way, namely as a collection of processes through which the necessary work gets done.
Process definition and characteristics
A process is a set of interrelated work activities having particular inputs and outputs. It also can be conceived as simply a method for doing things. If a project is to succeed, the collective, cumulative value of the outputs of its processes must exceed the value of the inputs. Chaotic processes (“muddling through”) may by luck lead to success, but carefully designed and continuously tweaked processes are much more likely to do so.
All processes share three characteristics:
A process converts the input to create the output. A conversion can be:
A process can contain more than one conversion, and may contain a mixture of the above types.
Feedback refers to information used to regulate the process to maintain desired characteristics of the output. It can be verbal information, or it can be an economic indicator such as revenue. Continuous or frequent feedback is needed to avoid degradation of the process.
Repeatability implies that a process operates more than once. Some processes repeat continuously; others are intermittent. Repeated processes should yield consistent results at each repetition. A plan not intended to ever be repeated is not generally considered a process. Thus, a project is by definition not a process, but within a project a number of processes may be needed.
Many processes cross one or more organizational boundaries. These are known as cross-functional processes. For example, change order management in a large manufacturing project usually is a cross-functional process. The more complex a process, the more prone it is to failure or degradation. Any change that simplifies the critical processes of a project will generally be a good thing, all else being equal. This is especially true of changes that eliminate organizational boundaries and flatten the organizational hierarchy.
All processes have some degree of conversion, feedback control, and repeatability, but only well managed processes will have the following properties:
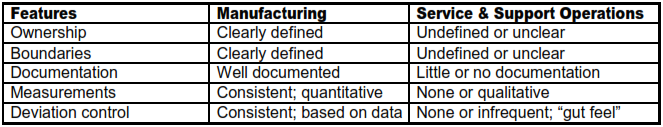
While the concept of process management has made considerable inroads into manufacturing, many services and support operations are still are not managed from a process point of view. Exhibit A-1 illustrates typical differences.
Exhibit A-1—Typical Differences between Manufacturing and Service Processes
The result of failing to properly manage a process is that it goes out of control. It becomes unpredictable, costly, and unprofitable. Its effectiveness is unknown. Reaction replaces management.
We now turn to the creation and improvement of processes. The steps we will examine are:
Process initiation
The two key actions needed to establish a new process are establishing ownership and establishing boundaries. Why is it necessary to establish ownership? In today's project environment, the most critical processes are usually cross-functional. Ownership can easily be ambiguous. Lack of accountability paralyzes action to correct problems, and makes for inefficiency, poor morale, and dissension among team members.
Ownership implies responsibility and accountability for a set of operations. A process owner is accountable for the functioning and performance of a process and should have the authority needed to change it.
In the case of cross-functional processes, ownership issues are likely to arise unless they are settled from the beginning. There are no universal rules for resolving such issues. Each must be resolved on an individual basis. If ambiguity exists, sometimes the best solution is for a senior or dominant personality to assume ownership until ownership can be resolved by consensus, or referred to senior management for resolution. This sometimes less than optimal ad hoc solution is generally better than leaving a critical process without ownership.
A commonly used rule of thumb in determining ownership of a cross-functional process is to name the manager who has the most resources invested in the process. Alternately, name the manager who will feel the most pain if things go wrong, or who is doing the most work in the process.
The process owner of a cross-functional process should be at a high enough level in the organization to see the process as part of the larger operational picture, to influence policy concerning the process, and to commit to a plan for process improvement. The owner is accountable for the process from end to end.
The most difficult ownership assignments are in complex, decentralized projects, with several hierarchical levels. To complicate matters, such projects often have duplicate functions at different locations. The easiest ownership assignments are in simple, flat organizations. This, by the way, is one of the best reasons to flatten an organization -- it greatly simplifies the management of cross-functional processes, or may even eliminate some cross-functional boundaries. As previously noted, cross-functional processes usually have the most waste.
Process boundaries mark the beginning and the end of the process. For example, the accounts payable process may start with receipt of an invoice (input) and end with the mailing of a check (output). Boundaries must be clearly defined to avoid ownership conflicts.
An interface is an internal transition point where the work leaves one organization and enters the next. Note that process boundaries can be interfaces where two processes join.
Interfaces are critical. Many problems relating to work flow occur at interfaces. Most problems at interfaces are caused by failure of communication across the interface. The process designers must be especially careful that the design is strongest at interfaces. Creation of unambiguous channels of communication is critical.
Probably the single best tool for strengthening communication across an interface is a memorandum of understanding (MOU), jointly signed by the leaders on either side of the interface, and by the process owner. The MOU should detail the requirements of the receiving organization ("customer"), and should identify the value-added activities that will be performed by the receiving organization. It is also wise to state what will be done in unusual circumstances, such as process failure.
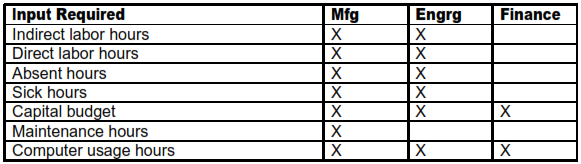
If requirements of the receiving organization are simple, a word description of them is adequate. If they are complex, other means of communication may be necessary, such as specifications, attribute lists, or flow charts. In the most complex situations, responsibility matrices can be used, as illustrated in Exhibit A-2. A situation that often arises, especially in manufacturing, is that several inputs from different departments cross an interface and simultaneously enter a particular activity in the receiving organization. Here, a responsibility matrix is especially useful. An example is shown below for part of an overhead rate setting process. If desirable for improved communications, the intersections of a responsibility matrix can be expanded to include short text rather than just X’s.
Exhibit A-2--Example of Responsibility Matrix
Process definition
Once a process has been initiated, it must be defined. Process definition should provide means to understand and communicate its operational aspects to all involved. It also should provide a baseline, or standard, for evaluating improvement.
When work activity procedures are simply word of mouth, or when they reside in obsolete or obscure documents, activities tend to be little understood by participants. Lack of understanding is highly conducive to waste.
How can an understanding of processes be communicated? In manufacturing, routings and operation sheets are in common use. A word description is adequate for simple processes. Almost every process can benefit from a flow chart.
Whatever documentation is used to define it, a process must have a baseline. The baseline fills in the details of how the process works in practice. Subsequent changes to the baseline establish new baselines, which must be reflected in revised documentation. Establishing the baseline comprises three activities:
Establishing process control
Three activities are important in process control:
Control points are steps in the work flow associated with actions such as checking, inspection, auditing, physical measurement, or counting. Without control points, a process becomes reactive, as opposed to controlled. The only feedback is from the ultimate customer. Waiting for customer feedback in projects can risk damage to the reputation of the project team. If it involves field recalls or replacements, it can become very expensive.
Generally, there should be one control point for each activity, but there can be exceptions. Use good judgment.
Process measurements mostly fall into one of five types:
Conformance measurements involve an inspection or verification as to whether the work product or service meets a specification or other set of requirements. Implicit in the measurement is the notion that something of direct or indirect value to the customer is being measured. Otherwise, the measurement is a waste of time and money. (Note: Customer in the sense the word is used here does not necessarily mean the overall project customer. It could refer to the owner of a process that receives work product from another process.)
Response time is the time (delay) needed to deliver the product, measured from arrival of the request until completion of the service, or, from start of performance of the service until completion. For some services (e.g., delivery of material) response time may be crucial. For product development, a critical time is the overall time used to complete the development, also called cycle time. Many administrative tasks also can be measured in terms of cycle time (e.g., patent searches, end-of-period closing of the books, SEC filings, customer order delivery, etc.).
Service level means the percentage of times a service or facility is available to a user at the time service is requested. It also means the percentage of times a needed item will be in stock. If a computer is down for maintenance 10 percent of the time, its service level is 90 percent. If a certain spare part is unavailable for 5 percent of the requests for it, its service level is 95 percent. Be aware: it may not be not possible, or even desirable, to achieve a 100% service level in a process. Unless human safety or life is at stake, a 100% service level may be prohibitively expensive.
Measures of repetition involve the frequency of occurrence of an activity. Examples are the number of times a training manual is redone, and the average number of changes to engineering drawings.
If an item is purchased, cost usually refers to its purchase price plus a fair share of any other costs required for bringing it to a useful state, so that value can be added to it, or it can be used to add value to something else. If an item is produced, cost usually refers to all money paid for direct labor and material, plus a fair share of cost of all activities related to the production. Both of these costs are important to process analysis, and both should be measured.
Process management focuses on waste. Costs should be carefully scrutinized for waste. In the case of manufactured or constructed products, waste can come from careless specification of materials, processes, finishes, or dimensions. Detection and correction of this type of waste is the province of value engineering. It is best done by a value engineering specialist. A more overt and easily detected type of waste is that due to poor quality. A useful concept for organizing the search for this type of waste is the cost of quality. Quality costs are traditionally divided into three major elements:
Failure costs are those directly related to not meeting requirements. They can be costs of correcting defects, costs of scrapped material or wasted labor, or warranty claims.
Appraisal costs are costs related to detecting nonconforming work, including inspections and audits.
Prevention costs are costs related to preventing future occurrences of nonconformance. Process improvement costs are usually prevention costs. Typically, investments in prevention are small relative to costs of appraisal and failure. Often, the project team will be able to demonstrate convincingly that a preventive measure will have a very fast payoff in terms of reducing failure or appraisal costs. If such a demonstration is not possible, often a relatively inexpensive test can be designed to determine experimentally whether or not a suggested improvement will have a payoff.
Measurements must be meaningful, timely, accurate, and useful. Any proposed measurement not having all of these attributes should be rejected. In the selection of measurements, the following steps can be helpful:
An outline is given in Exhibit A-3 for a process measurement chart. This is a useful accompaniment to a process flow chart (Exhibit A-4).
Exhibit A-3--Process Measurement Chart Outline
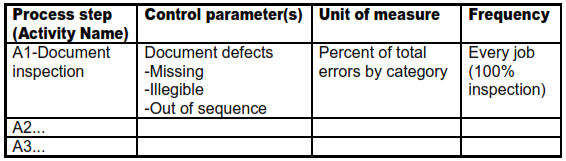
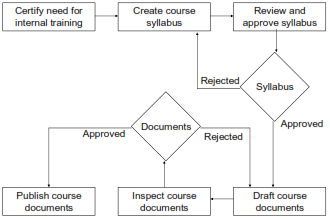
Exhibit A-4—Example Process Flow Chart
Process Flow for Production of Internal Training Documents
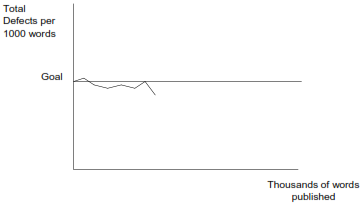
Measurements can usefully be presented in graphical time series format, and the target or control limits should appear on the graph. A graphical format is easily read and understood by everyone. See the example in Exhibit A-5.
In keeping with the spirit of continuous process improvement, the technique of ratcheting targets is highly recommended. Target ratcheting involves periodic reassessment of actual defect or failure data in comparison with its target or objective values. When actual results are consistently achieving or bettering targets over a period of time, the target is adjusted to a more difficult level. In this manner, new goals are set periodically. Targets may be derived from physical capability studies, benchmarking, or traditional competitive comparisons.
Exhibit A-5—Example Process Output Tracking Chart
Control Chart for Internal Training Document Production
How can feedback and corrective action be accomplished? The process owner is responsible to see that feedback occurs and that appropriate action is accomplished. Probably the best feedback is a graphical time series chart as previously noted.
Feedback should be presented constructively, not in a punitive or threatening manner. If feedback is viewed as a weapon or a punishment it will be resisted.
Determination of corrective action is best done as a consultative group process. The people closest to the work can see the best changes to make, but their ideas need to be tempered by the broader view available to the process owner.
Process analysis and evaluation
Process analysis is a systematic examination of a process with a specific objective in mind, such as reducing cost or cycle time, or otherwise improving the process. To facilitate the examination, flowcharts should be made if they do not exist.
The process is first assessed and then opportunities for improvement are evaluated. If the proposed improvements are accepted by management, they are implemented. This seems straightforward, but it is fraught with opportunities for error, misunderstanding, and dissatisfaction of all concerned. Change can be a hard thing for people to accept.
The first cardinal sin of process analysis and evaluation is to get too far ahead of your customer or your management, i.e., to press urgently for changes whose potential effects they do not yet fully understand and accept, or which appear to go against their culture or business goals.
Change agents in a project must always be extremely sensitive to clues that a process assessment is about to tread on sacred ground. Nevertheless it is possible that a recalcitrant manager, for purely personal reasons, will stand in the way of a change that cries out to be made. If such a manager cannot be swayed by facts, statistics, or even experiments, it will be necessary to try to go around or over him or her. However, the change agent should proceed by "indirection" whenever possible. Pressures on the obstinate manager should come from colleagues or superiors, not from the change agent.
In going around or over an uncooperative manager, the change agent must keep in mind the second cardinal sin of process analysis and evaluation: it is to criticize an uncooperative manager to his colleagues or superiors. On the contrary, an uncooperative manager should if at all possible be praised for "help," "useful insights," and for making his or her "valuable time available."
The initial stage of process analysis is to ask questions, much as a news reporter would, but certainly not in the overbearing and aggressive style adopted by some reporters. Typical questions are:
Process optimization
Not surprisingly, there is considerable interest in “optimizing” processes, that is, making them as good as they possibly can be. This is a complex issue. Among the many questions that could arise are:
The week these words were written, a news article appeared explaining how some companies had inexpensively optimized certain processes using some recently evolved mathematics called complexity theory. For example, one airline hired some bright mathematicians headquartered in New Mexico to find a way to “optimize” certain baggage handling operations. The claim was made that for a one-time expense of only $60,000, the mathematicians were able to shave a couple of million dollars off the annual costs of baggage handling. The article went on to predict a bright future for complexity theory in process optimization, or at least in process improvement.
The authors tend to agree that complexity theory may eventually be a big help in this regard, especially in commercial operations where large scale processes work more or less independently of other processes. We are not so sure about processes in projects. Some project oriented organizations design processes in accordance with agreed standards such as CMMI. If this is a customer expectation, they must do so to be considered in bidding compet