Independent, which time unit, is applied price movement charts form different kinds of
periodically repeating equal patterns. Some of those patterns always occur on charts before the trend reversal when the volume is significantly decreasing or increasing. Such formations known as
reversal patterns are considered below.
Head-And-Shoulders. The head-and-shoulders pattern is one of the most reliable and well-known chart formations. It consists of three consecutive rallies (See Figure 4.13). The first and third rallies—the shoulders— have about the same height, and the middle one—the head—are the highest. All three rallies are based on the same support line (or on the resistance line in the case of the reversed head-and-shoulders formation), known as the neckline. A real example of the head-and-shoulders pattern is shown on the Figure 4.14.
Figure 4.13. Diagram of a typical Head-And-Shoulders pattern.
Prior to point A, the neckline was a resistance line. Once the resistance line was broken, it turned into a significant support line. The price bounced off it twice, at point’s В and C. The neckline was eventually broken in point D, under heavy volume, and the trend reversal was confirmed. As the significant support line was broken, a retrenchment could be expected to retest the neckline ( E), now a resistance line again. If the resistance line held, the price was expected to eventually decline to around level F, which was the price target of the head-and-shoulders formation. The target was approximately equal in amplitude to the distance between the top of the head and the neckline. The price target was measured from point D, where the neckline was broken (line DF on Figure 4.13).
2001 by Royal Forex. All right reserved. www.royalforex.com
31
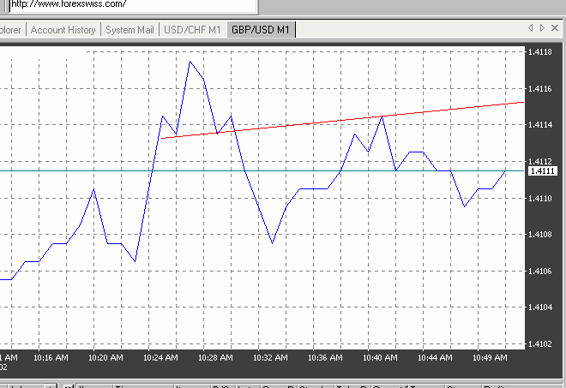
Figure 4.14. Example of a real head-and-shoulders pattern in the Pound Sterling chart.
Signals generated by the head-and-shoulders pattern. The head-and-shoulders formation provides
excellent information:
1.The support line. This is based on point’s В and C.
2. The resistance line. After giving in at point D, the market may retest the neckline at point E.
3. The price direction. If the neckline holds the buying pressure at point E, then the formation provides information regarding the price direction: diametrically opposed to the direction of the head-and-shoulders (bearish).
4. The price target. This is provided by the confirmation of the formation (by breaking through the neckline under heavy trading volume).
One of the main requirements of the successful development of this formation is that the breakout
through the neckline occurs under heavy market volume. A breakout on light volume is a strong warning that it is a false breakout and will trigger a sharp backlash in the currency price. The time frame for this chart formation's evolution is anywhere from several weeks to several months. The intraday chart formations are not reliable.
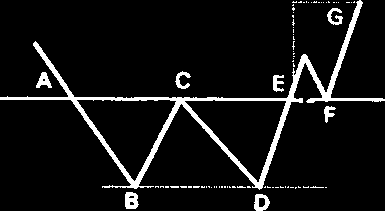
Inverted Head-And-Shoulders. The inverted head-and-shoulders formation is a mirror image of the previous pattern. (See a diagram on Figure 4.15 and a real example on Figure 4.16). Therefore, you can apply the same characteristics, potential problems, signals, and trader's point of view from the preceding presentation. The underlying currency broke out of the downtrend ranged by the xx'-yy' channel. The currency retested the previous resistance line (the rally number 3), now turned into a support line. Among the three consecutive rallies, the shoulders (1 and 3) have approximately the same height, and the head is the lowest. Prior to point A, the neckline was a support line. Once this line was broken, it turned into a significant resistance line. The price bounced off the neckline twice, at point’s В and C. The neckline was eventually broken at point D, under heavy volume. As the significant resistance line was broken, a retrenchment could be expected to retest the neckline ( E), now a support line again. If it held, the price was expected to eventually rise to around level F, which is the price target of the head-and-shoulders formation. The price objective is approximately equal in amplitude to the distance between the top of the head and the neckline, and is measured from the breakout point, D.
2001 by Royal Forex. All right reserved. www.royalforex.com
32
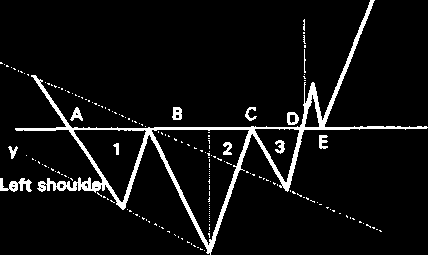
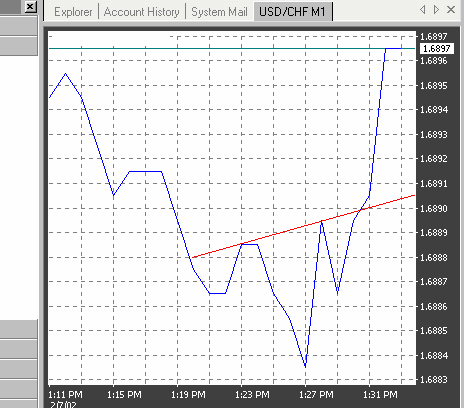
Figure 4.15. Diagram of a typical inverted head-and-shoulders pattern.
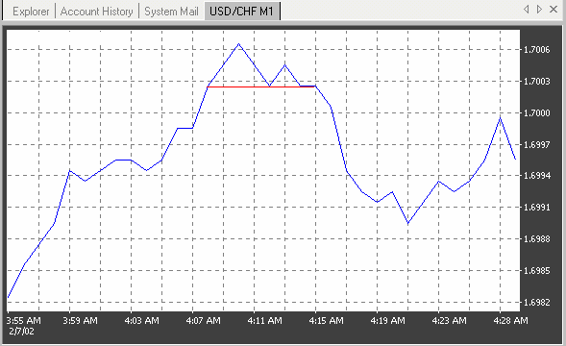
Figure 4.16. An example of an inverted head-and-shoulders pattern in the Swiss franc chart.
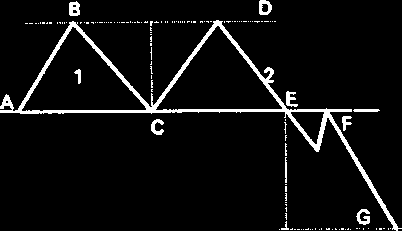
Double Top. Another very reliable and common trend reversal chart formation is the double top. As the name clearly and succinctly describes, this pattern consists of two tops (peaks) of
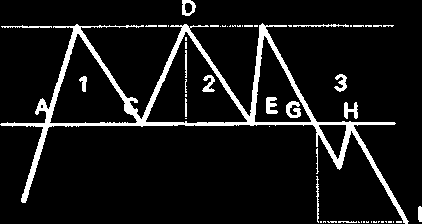
approximately equal heights (See Figures 4.17 and 4.18). As it is shown on the Figure 4.17, a parallel line is drawn against a resistance line that connects the two tops. We should think of this line as identical to the head-and-shoulders' neckline. As a resistance line, it is broken at point A. It turns into a strong support for price level at C, but eventually fails at point E. The support line turns into a strong resistance line, which holds the market backlash at point F. The price objective is at level G, which is the average height of the double top formation, measured from point E.
Signals provided by the double top formation. The double top formation provides information on:
1. The support line, set between points A and E.
2. The resistance line, set between points В and D.
3. The price direction. If the neckline holds the buying pressure at point F, then the formation provides information regarding the price direction: diametrically opposed to the direction of the
peaks (bearish).
2001 by Royal Forex. All right reserved. www.royalforex.com
33
4. The price target, provided by the confirmation of the formation (by breaking through the neckline under heavy trading volume.)
Exactly as in the case of the head-and-shoulders pattern, a vital requirement for the successful
completion of the double-top formation is that the breakout through the neckline occurs under heavy
market volume. A breakout on light volume is a strong case for a false breakout, which would trigger a sharp backlash in the currency price. The time frame for this chart formation's evolution is anywhere from several weeks to several months. The intraday chart formations are less reliable. There is a strong correlation between the length of time to develop the pattern and the significance of the formation.
The target is unlikely to be reached in a very short time frame. There is no direct suggestion regarding the length of target reaching time; but foreign exchange common sense links it to the duration of development.
It is important to measure the target from the point where the neckline was broken. Avoid the trap of measuring the target price from the middle of the formation under the neckline. This may happen as you measure the average height of the formation.
Neckline
Figure 4.17. Diagram of a typical double-top formation.
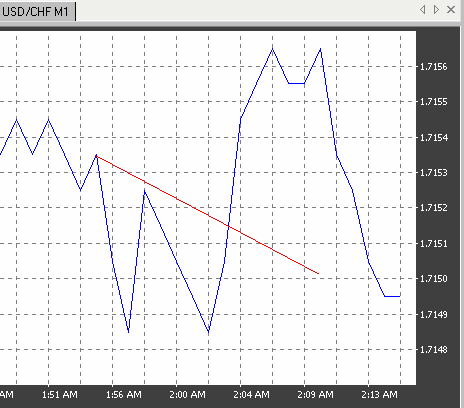
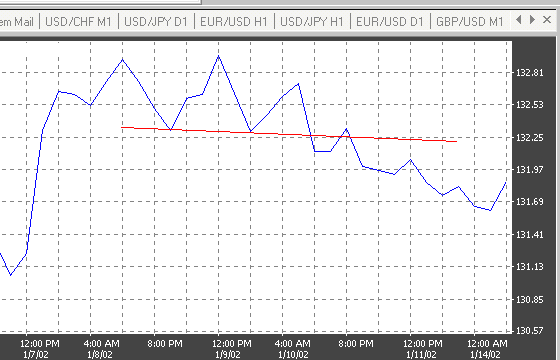
Figure 4.18. An example of a double-top formation in the Swiss franc chart.
2001 by Royal Forex. All right reserved. www.royalforex.com
34
Double Bottom. The double bottom formation is a mirror image of the previous pattern (See Figures 4.19 and 4.20). Therefore, one may apply the same characteristics, potential problems, signals, and trader's point of view from the preceding presentation. As it is shown on Figure 4.19, the bottoms have about the same amplitude. A parallel line (the neckline) is drawn against the line connecting the two bottoms ( B and D.) As a support line, it is broken at point A. It turns into a strong resistance for price level at C, but eventually fails at point E. The resistance line turns into a strong support line, which holds the market backlash at point F. The price objective is at level G, which is the average height of the bottoms, measured from point E.
Neckline
Figure 4.19. Diagram of a typical double-bottom formation.
Figure 4.20. An example of a double-bottom formation in the Swiss franc chart.
Triple Top. The triple top is a hybrid of the head-and-shoulders and double-top trend reversal formations (See Figures 4.21 and 4.22). Consequently, they have the same characteristics, potential
problems, signals, and trader's point of view as the double top or double bottom, respectively.
As shown in Figure 4.21, in a typical triple-top formation, the tops have about the same height. A
parallel line (the neckline) is drawn against the line connecting the three tops ( B, D, and F). As a resistance line, the neckline is broken at point A. It turns into a strong support for price levels at С and E, but eventually fails at point G.
The support line turns into a strong resistance line, which holds the market backlash at point H.
The price objective is at level I, which is the average height of the three tops formation, as measured from point D. As a double top, the formation fails at point E. The price moves up steeply toward point F. The
2001 by Royal Forex. All right reserved. www.royalforex.com
35
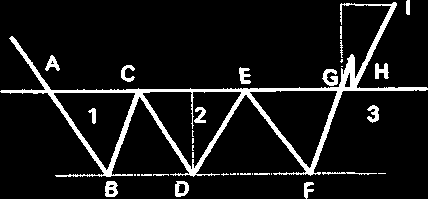
resistance line is holding once more and the price drops sharply again toward point G. At this level, the market pressure is able to penetrate the support line. After a possible retest of the neckline, the prices drop further, to eventually reach the price objective.