Simulation:
The system can be simulated with replications (keep around 5) and for a period of 1 month or more (a month can help in monitoring and control with monthly values)
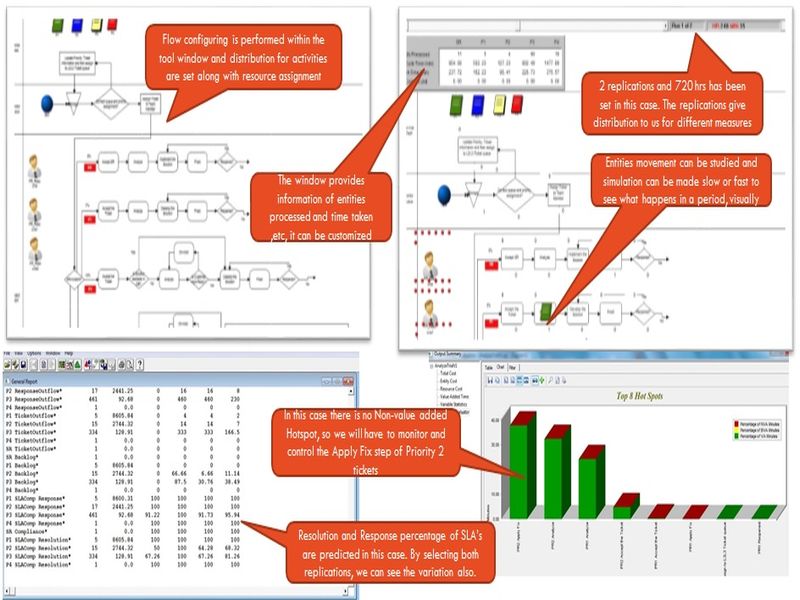
The simulation can be run with or without animation. The results are displayed as output details. The reports can be customized by adding new metrics and formulas.
The output summary containing “Hot Spot” refers to idle time of entities or waiting time in queue. This is immediate area to work on process change and improve the condition. If there is no Hot Spot, we need to study the activity which has High Standard deviation or High Mean or both of individual activities and they become our critical sub processes to control.
Validating Results:
It’s important to validate, whether the system replicates the real life condition by comparing the actuals with predicted values of the model. We can use MAPE and the difference should be less than 10%.
Optimization:
In order to find the best combination of resource assignment (ex: with variation in skill and count) with different activities, we can run “SimRunner”. The scenarios which we defined earlier are going to be the controllable factors and a range (LSL and USL) is provided in the tool, similarly the objective could be to minimize the resource usage and increase entity servicing or reducing elapsed time, which can be set in tool.
The default value of convergence, simulation length can be left as it is and the optimization is performed. The tool tries various combination of scenario value with existing system and picks the one which meets our target. These values (activity and time taken, resource skill, etc) can be used for composition of processes.
Process Modelling -Validation
In a Maintenance Project they are receiving different severity incidents (P1,P2,P3,P4) and their count is around 100 in a day with hourly variation and there are 2 shifts with 15 people each (similar skill). The different activities are studied and their elapsed time, count etc are given as distributions (with mean, S.D, median and 10%, 90% values). The Project team want to understand their Turn-Around-Time and SLA meeting. They also want to know their bottlenecks and which process to control?
Process Modelling -Tools
The tools of Matlab, SAS JMP has their own process flow building capabilities. However specific to queuing model, we have seen BPMN process simulation tool, which is quite exhaustive and used by many. The tool has the ability to build and simulate the model.
ARIS simulation tool is also another good tool to develop process system and perform simulation.
While considering the tools we also needs to see the optimization capabilities of the tools, without which we have to do many trial and error for our ‘what if analysis’.