Define and Achieve Project Objectives and QPPOs
Defining Project Objectives and QPPO:
Project Objectives:
The Purpose of any project or Operation is to create/perform a work product/activity which delivers values to the customer. In addition, how well the project/operation is performed in terms of cost, quality, time and utilization, etc are critical to achieve Business Purpose of the Organization. On the other side when an Organization has identified its Business Objectives to be achieved, it can only be achieved by Projects/Operations meeting the value at Individual Level. Hence Project objectives has to be aligned with Business Objectives, unless the client given objectives take priority or Current performance is much better /lower than Organizations business objective or some of the Objectives has impact on other identified objectives, etc. So every Project has to define their Project objectives in alignment with Business Objectives. When the Project objective is not as per Business Objective, then it has to be informed to senior management and approval has to be sought. This helps if many projects are getting such situation, we may not achieve business objective, hence it has to be a conscious decision by management.
The Project Objectives can be defined as SMART Objectives as defined in the Business Objective. However usage of Confidence Level for a Project Objective depends on how frequently and how many times the measure will be collected. When a measure like Profit Margin is computed in yearly basis we may not be able to give confidence level, however the same when monthly profit margin or Operational Effectiveness ratio is calculated its possible to have confidence level in definition of the measure.
Project QPPO:
In order to achieve the Project Objectives the Project level quality and process performance objectives has to be identified. This can be taken from existing Organizational BO, QPPO relationship and can be introduced at project level or when the project objective is client given then the logical QPPO should be identified. The QPPO’s to be SMART in nature. New QPPO’s at project level is to establish statistical relationship with Project Objectives, and for existing QPPO’s the Organizational level relationship can be inherited if the conditions are valid. Based on the Project Objective and using existing relationships the target for QPPO has to be set. For example if we want customer satisfaction more than 4.25 as index (whereas organization BO had from 3.75 onwards) in a project level to maintain their reputation with International client, the QPPO also has to have relevant value of Defect Density less than 1.0 Defects/Unit (where Organizational QPPO may have less than 1.5 Defects/Unit). So Plan target of QPPO to achieve the target given in Project Objectives. QPPO’s can have Confidence Level and also it should be like that of getting values multiple times to use statistics. QPPO and Project Objective can’t be in same frequency and at same time, then we don’t need QPPO to track, because Project Objective is directly available. Hence QPPO frequency is higher than that of Project Objectives.
Both Project Objectives and QPPO’s to have Prioritization and this is useful when anyone of the Objective is impacted while achieving the Other Objective. As given in the Project Objectives their respective QPPO’s can have prioritization.
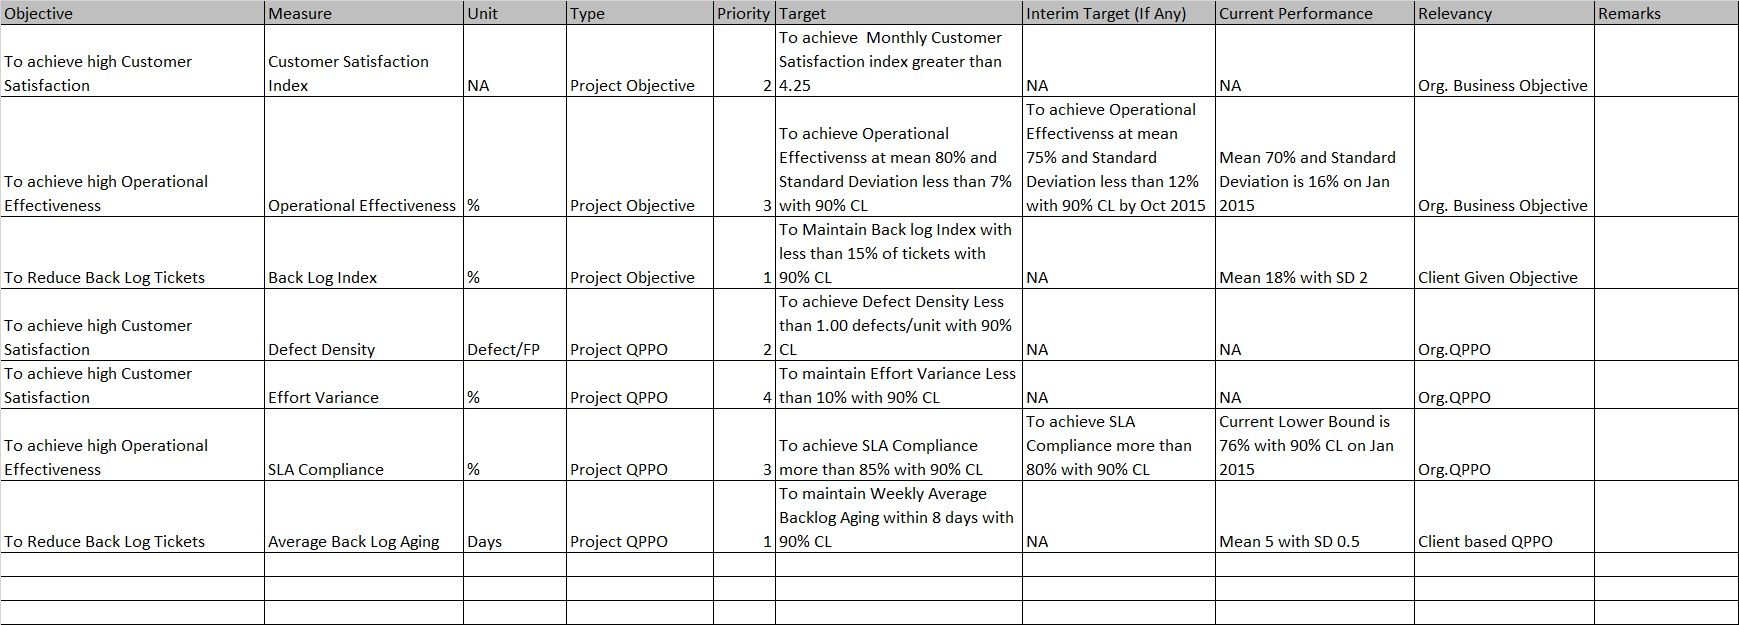
Sample Case
In our case of example here we are going to take one client given objectives and two existing Business objectives for defining project objective and QPPO’s. The assumption is the project is having application development and application maintenance activities both. The application maintenance activities provides data periodically, however application development is more release and phase based. The major enhancement falls under application development. Also we assume that customer satisfaction feedback is largely dependent on quality of product delivered in this case. Considering the project is running for few months by the time CMMI HM practices have been introduced for some of measures we know the current performance, if so the following table will help in documenting the objectives.
Project Process Composition:
It’s nothing but selection of process/sub-process to be part of lifecycle to deliver a product/service by knowing the processes ability to meet the Quality and Process Performance Objectives. Which means either we have alternate processes for any given steps or we have factors which can influence process depth of application, by knowing they would deliver different performance. To see this better, as a first step let’s make the processes to be used in a deliver lifecycle to be available as process flow.
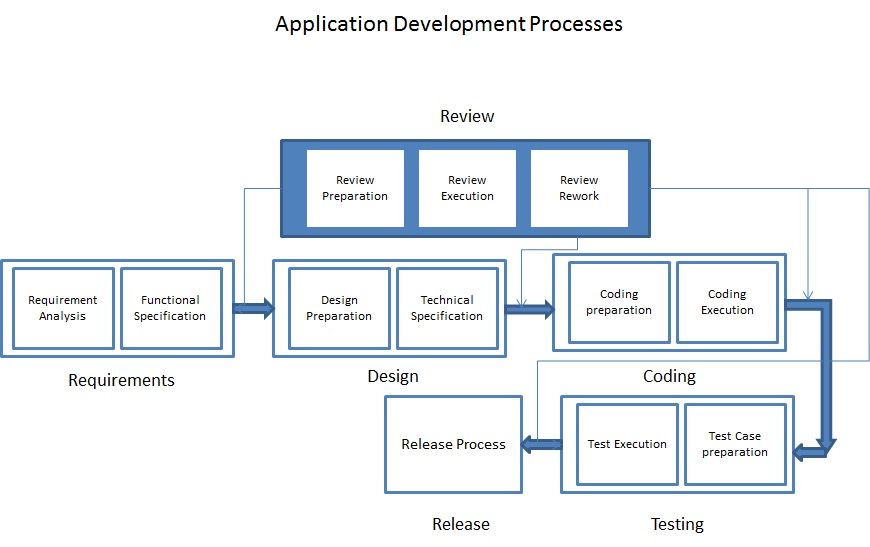
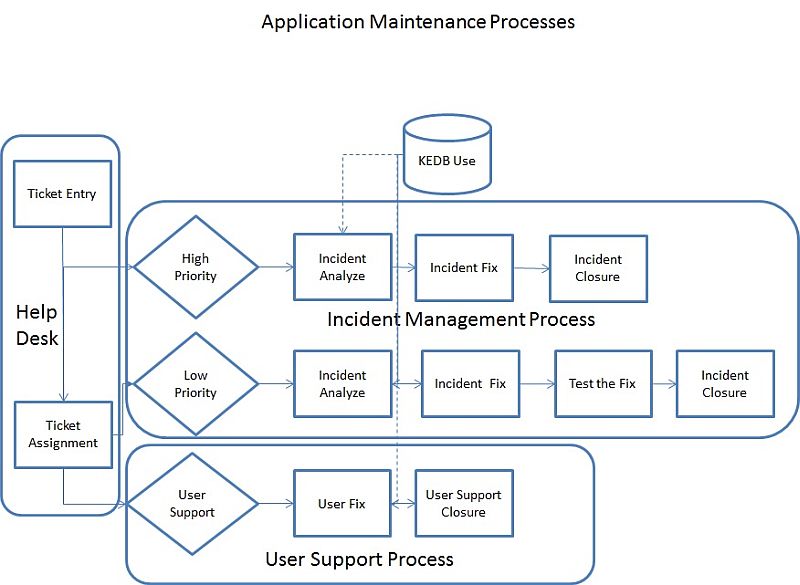
There are places where it’s possible for us to split the processes in to sub process, which has specific tasks and clarity in outputs and roles involved. As a first step here we have identified the possible sub processes and Processes. As a second step we need to understand which are the process/Sub Process where alternates are available and where their performance are known. Select those sub process for composition. In addition a simple Process Composition model, which is either based on existing PPM created at Organizational level or prepared at project level using past data, can be used to perform what if analysis. Which means, we select the sub-process/process based on their performance and potential contribution in achieving the QPPO and/or we fix target for the sub process and processes within which they have to perform, so that the QPPO can be achieved.
A case like defect density is the QPPO, whereas we have Review process with us can be considered with technical review or inspection or walkthrough method. All three would offer different performances and in past if we have used these methods their performance has to be part of Process Performance Baselines and if not, it’s expected to baseline. Similarly there are other processes with alternate and their baselines are taken. These baseline values are fed in to the Organizational PPM on defect density and what if analysis is performed. To manually perform what if , you may need to select different methods combination in each calculation using PPM, and reduce by 5%, 10%, 20% the values (basically that much improvement) or just use different method and see if target from calculation is achieved.
Whereas using automated what if tools like Crystal ball optimizer can select the best possible combination for us.
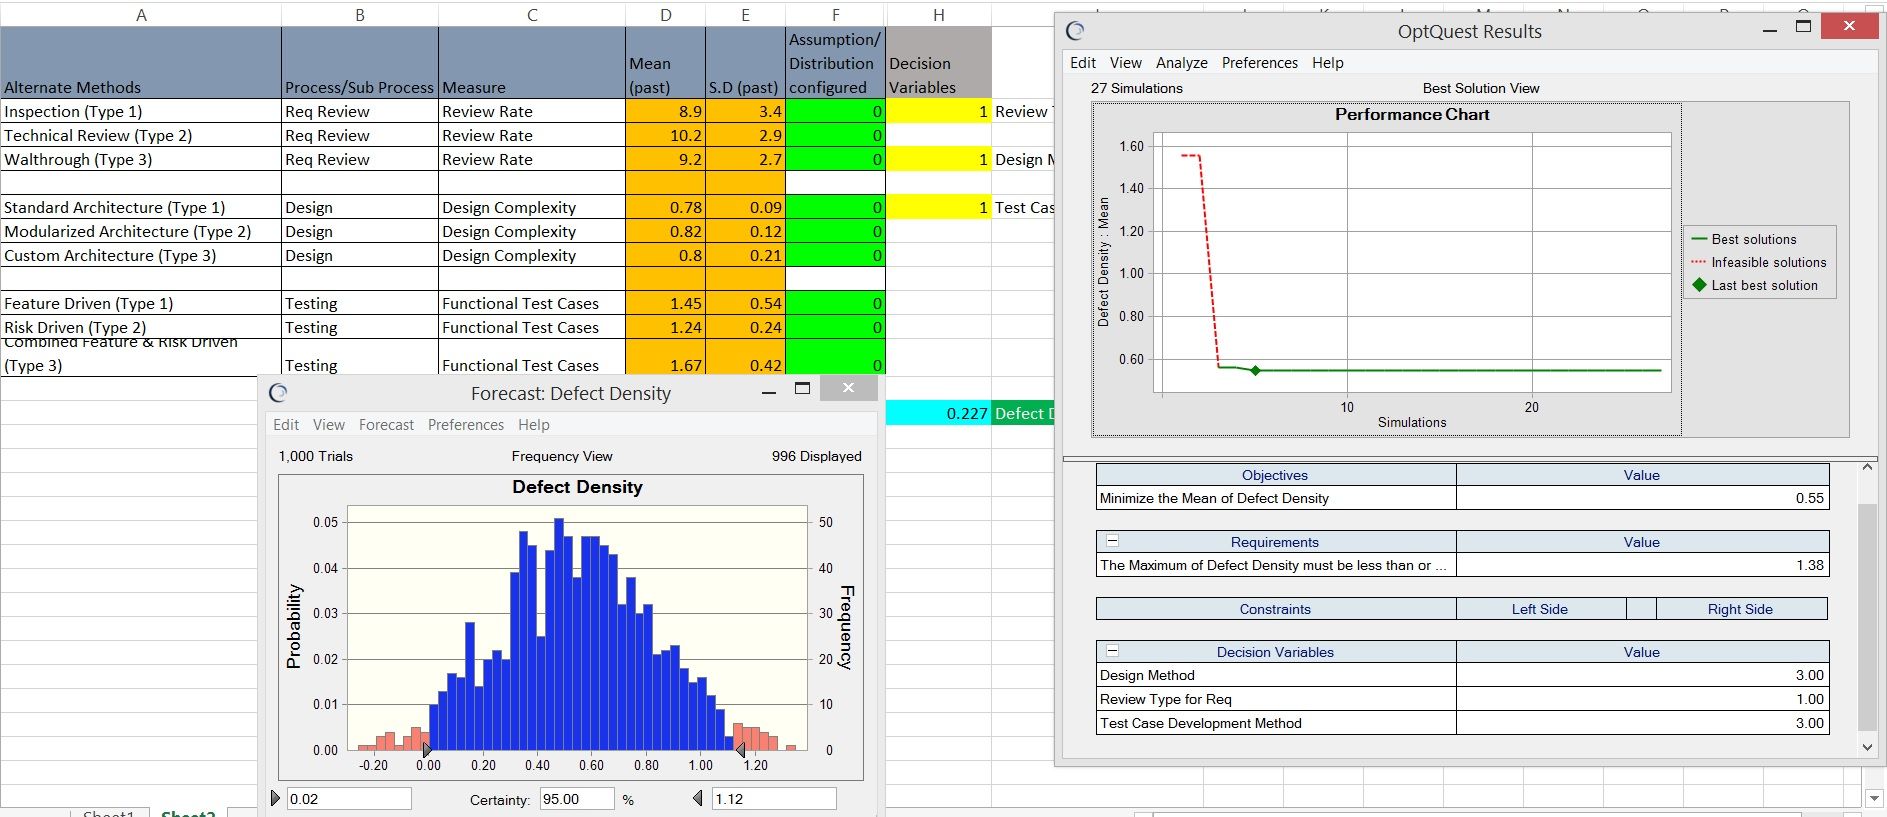
The model can provide the best possible combination of Processes for which it delivers the expected defect density. When none of the existing processes are able to achieve the target, we may chose an improved target for upto 20% at first level and run the model to see if the targets are meeting, still if we don’t achieve the targets then we fix interim target of QPPO to ensure that practicality still wins.
Similarly when no alternate process is possible then level of application like number of reviews, reviewers, processing time, usage of tools, repository usage, skill level of people, etc can be used to check the process performance meeting targets, there by what if and process composition is achieved.
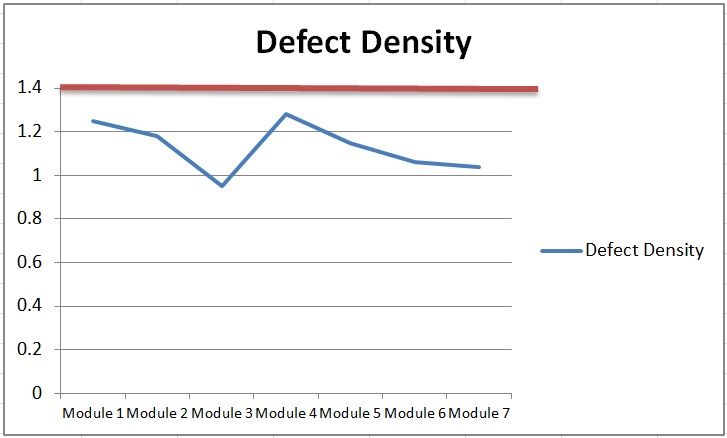
In our example its limited to defect density QPPO, the Crystal ball tool has suggested to use the combination of inspection for review, custom architecture in design and combined feature and Risk driven test methodology. On using this combination of processes, we will achieve defect density less than 1.38 Defects/size with 95% certainty.
Typically when we have multiple QPPO’s we have to have common PPM or Composite PPM, which is useful in performing the trade-off between processes or even at QPPO level with process performance in composing the processes for project.
Having selected the processes to be used in projects, the same has to reflect in the lifecycle.
Sub Process & attributes Selection for Monitoring and Controlling:
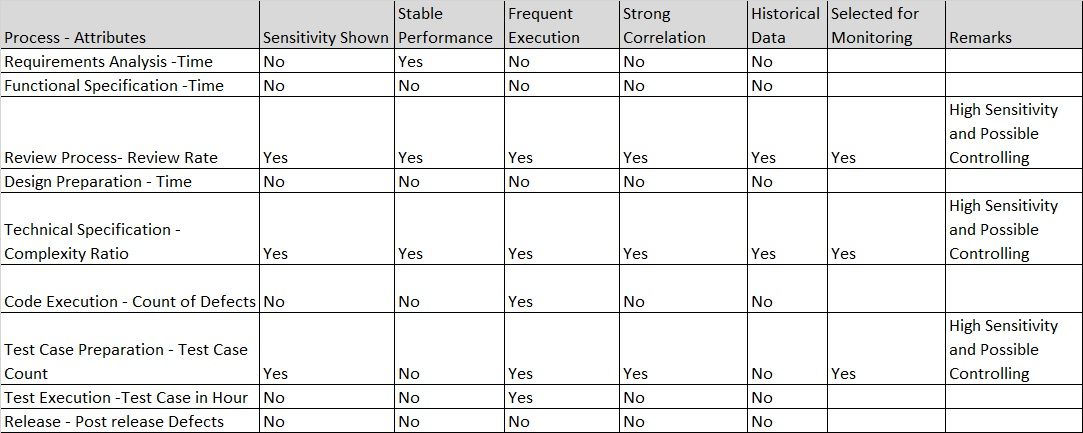
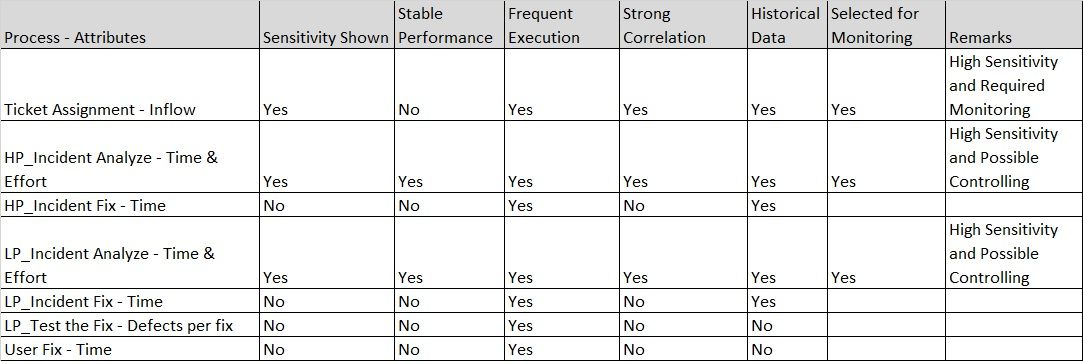
Along with Process Composition it’s important to see which of the sub process will be monitored using statistical and quantitative techniques and be controlled. The Sub process which has shown high sensitivity in PPM or in calculations, where past data is available and data collection is possible for future, Logical correlation exist and its adequately frequent to perform in progress control. The sub processes which meets most of the criteria is selected for monitoring and control.
For example Sensitivity chart for defect density reveals that Requirements Review, Design Complexity and Functional Test Case preparation has higher influence on variance of Defect Density Results.
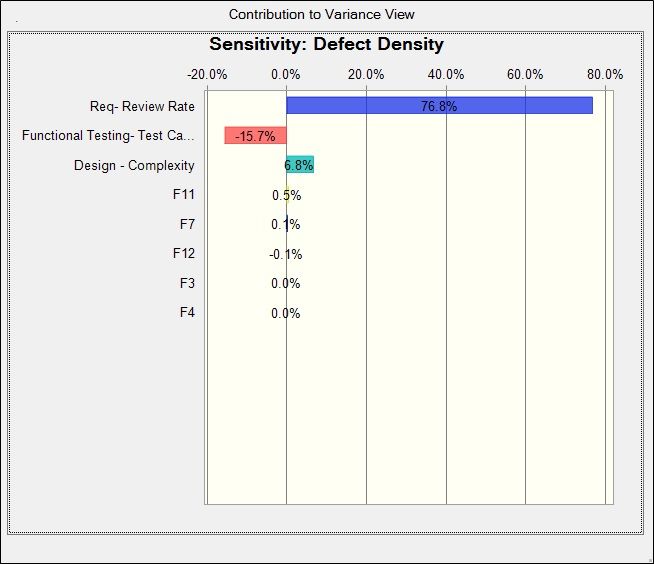
Where the count of Functional Test Case increase would negatively impact the defect density by reducing it. On the other hands the Req-Review Rate and Design Complexity increase also increases the defect density.
Based on this, further criteria for the sub process selection should be used to select sub process and their attributes for statistical and quantitative monitoring,
Defect Density QPPO – Sub Process/process Selection with attributes
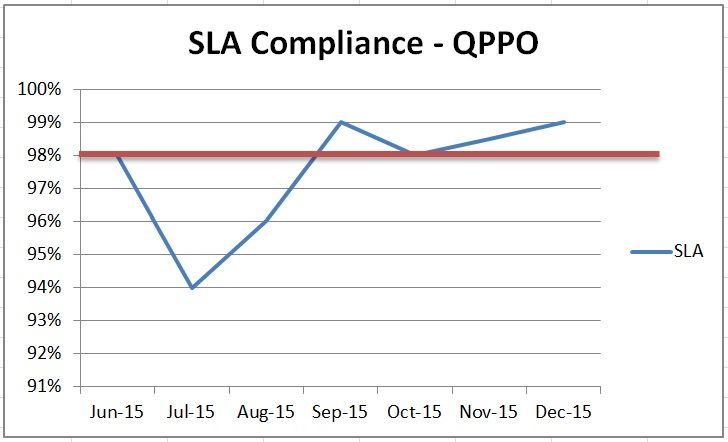
SLA Compliance QPPO – Sub Process/Process Selection with their Attributes,
Measures and their Analysis is given in table,
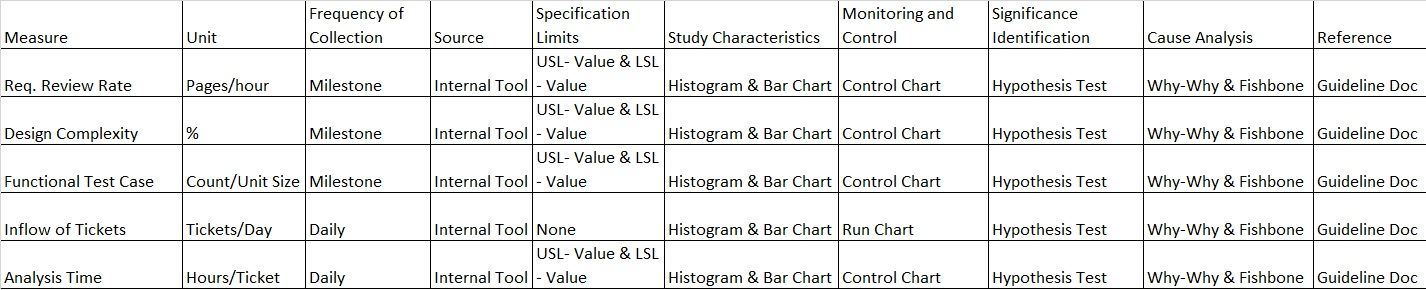
Which contains the analysis techniques to be used and further guidance to be elaboration in organizational or project level guideline document on how to use the charts and interpret. The specification limits comes from what if analysis which has to be used for Sub process/ Process monitoring and controlling, in order to achieve the expected QPPO results.
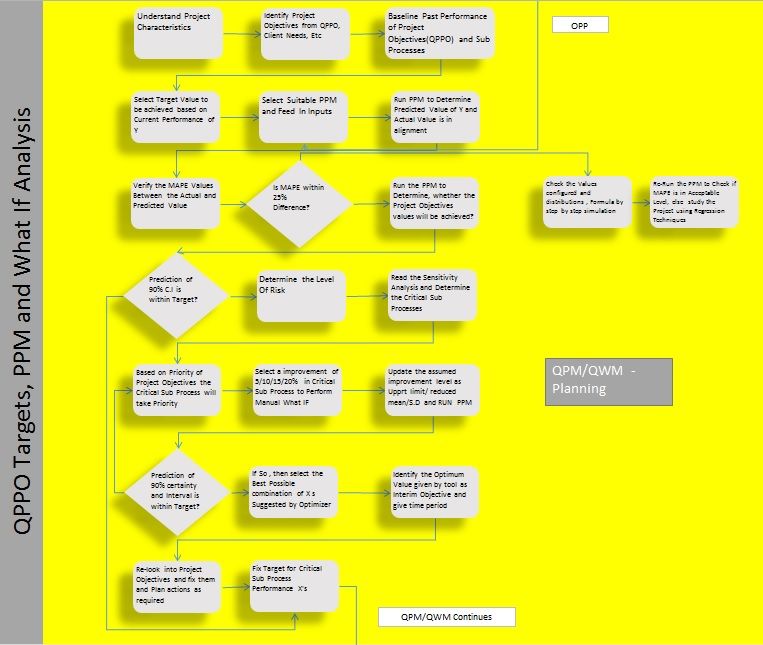
Prediction using PPM and Planning Actions:
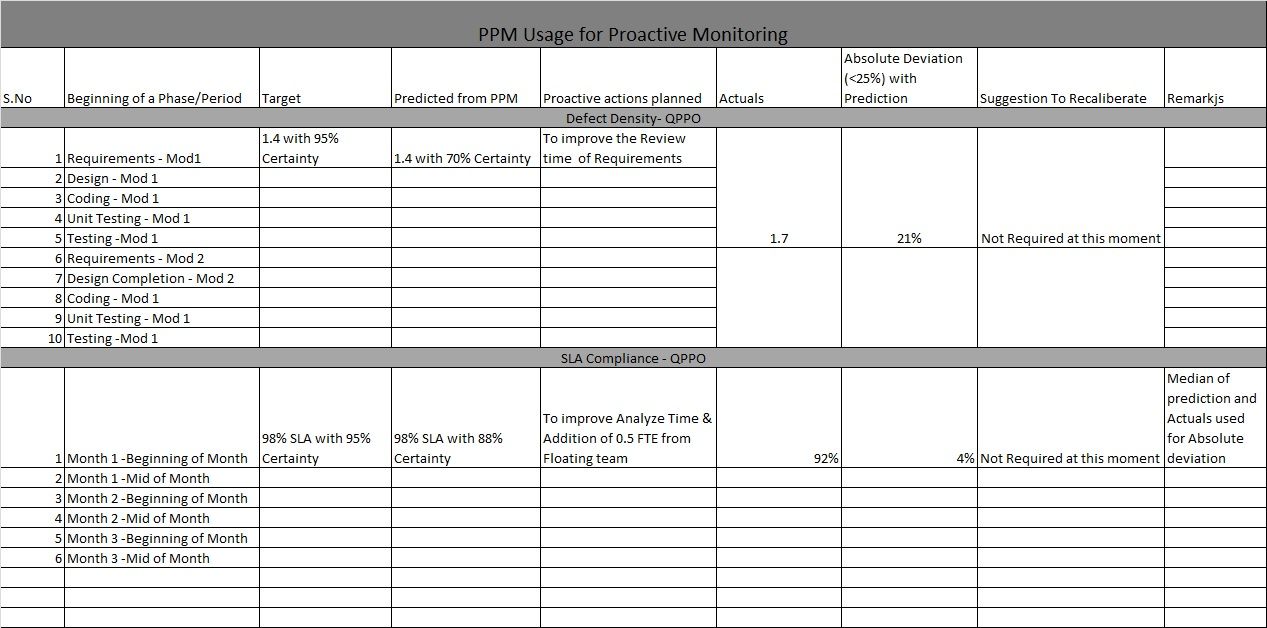
The Purpose of having a PPM is to understand proactively the ability to achieve the target and where needed proactive actions are taken to ensure achievement of the target. At the beginning of a new Project there may not be any PPM available with them, hence they can use the organizational PPM published for their predictions. However its important to understand the PPM applicability in a given project conditions. In some cases where dynamism is high the PPM can be prepared using the project data itself, typically the Application Maintenance or any services based activities will fall mostly in to this category. Hence collection of data at project level and then building a PPM might be required. Usage of Organizational PPM to start with or Building own PPM both are dependent on context and they both are acceptable. Once the PPM is selected the frequency at which we run is important for any proactive monitoring and controlling. Based on type of work they can be run on milestone basis or on periodical basis, however in both conditions its run at the beginning to understand what will be the achievement of target. In addition the PPM has to use in the mid-course of the phase/period to accommodate if there is any change in X factors or performance of Sub Process, etc.
Typically the PPM’s are either to predict the range of values which would occur or the certainty with which the target will be achieved. Its not an forecasting model to predict the exact next value which would occur. Based on the predicted value, its expected the actions are planned by the project team to improve the target achievement or certainty. Typically it’s boiled down to controlling the X factors (controllable) and Monitoring some of X factors (uncontrollable) and managing the characteristics of the Project.
It’s important to track the predicted value with actual value, to ensure the values are not too different. The usage of Mean Absolute Percentile Error (MAPE) is often helpful. For simplicity in conditions the absolute deviation between the predicted and actual should not be more than a certain value (ex: 25%) , in case if it exceeds, its important to study the PPM factors and if needed it has to recalibrated.
Recalibration of PPM can happen when a) Planned change in performance of Sub Process/Process b) High Variation found in actual vs predicted, which on causal analysis found change in influence of X factors c) Change in QPPO and/or business conditions d) X factors (when uncontrollable) are found to be operating in values, beyond the current range of PPM boundaries.
At the Beginning of the PPM usage, we may not have X factors baselined at project level so we may the Organizational Process performance baseline and run the PPM. However as we proceed with phases/period and when we get the actuals we will keep replacing the values with actuals and where we are yet to get the values (ex: the phase of functional test creation is yet to happen) we will use the organizational values. So with these values we will be running the PPM and will see the target achievement prediction.
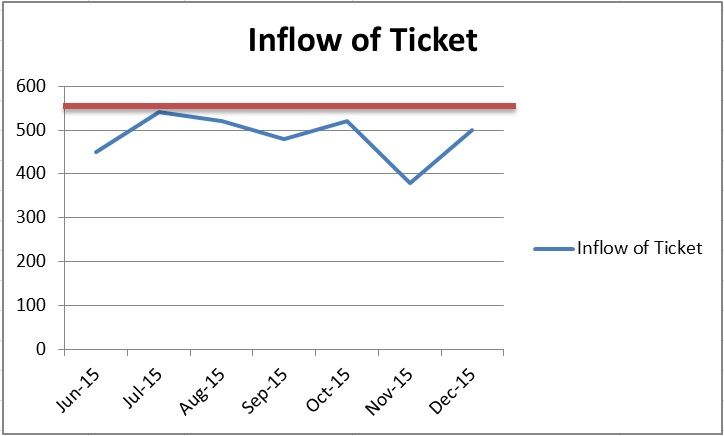
We would change the X factors range only when it has a new performance baseline and its statistically validated, however the influencing and uncontrollable X factors (like inflow of ticket) for which when we get sufficient information we may alter the values in PPM and run.
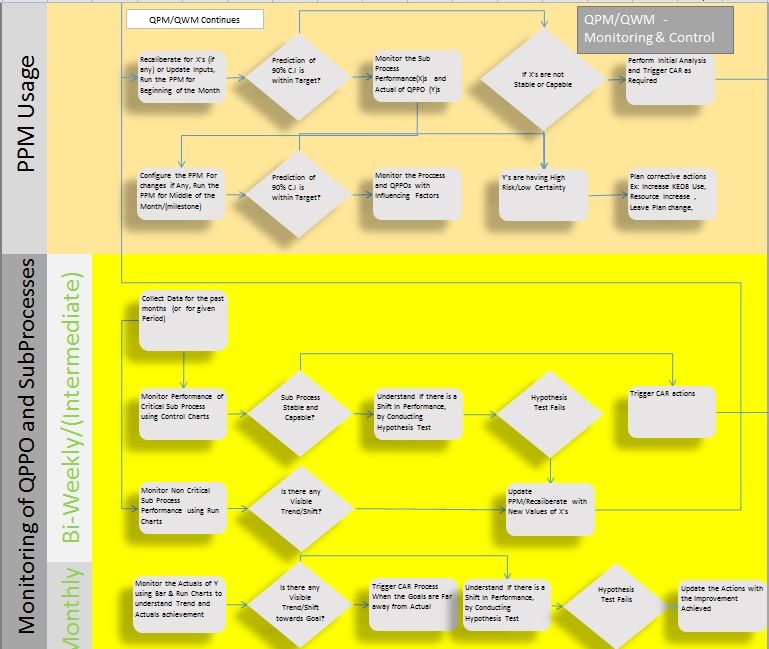
Monitor performance of Selected Sub Process
The process/Sub Processes selected for monitoring has to be tracked for their performance. The specification limits are typically derived from what if analysis. The trial control limits for any selected sub process to be established with existing organization’s baseline of the sub process measure. We are terming it as trial limit here not because it has less data points, but the process performance is taken from organizational baseline. Once we get project level data we keep appending in the relevant charts to see if the performance is same or its differing. When the performance is quite different than the Organizational baseline (which you can understand by consistent outliers, stability test failures in control charts) its important to baseline the projects’ process performance (with sufficient data , min >8 data point or >20 data point) and use that value. Hypothesis tests can help in finding the baseline value. When we have more than 20 data points then the control limits derived from there is called natural limit.
The Processes selected for Monitoring will be collecting data as per the defined frequency, which is typically event basis/periodical basis and keep plotting the data in the selected charts. Typically control charts are used for statistical process control. Please see the Process Performance Baseline section to understand more on control charts. The data are plotted with existing control limits and checked for stability using stability tests (western electric rules). When data points fails in the stability tests then those specific data points are studied to understand the cause and where its one time failure then actions are initiated to prevent re-occurring. However if the points are more and following a pattern or unable to assign any cause then its time to initiate a causal analysis process to do systematic changes to improve the conditions.
Similarly when the control limits are within the Specification limits then we can classify them as Capable Process. When they are overlapping on each other for some portion, then its better to do Cpk calculation and check the process capability, along with declaring its not capable process. The process capability will tell us how much we need to improve. A Cpk value more than 1.33 is considered as capable process. When the process is not a capable process then also the causal analysis can be triggered.
When a control chart has very few outliers and they have assignable causes then they can be removed from calculation of baseline, however we may choose to present them in control chart.
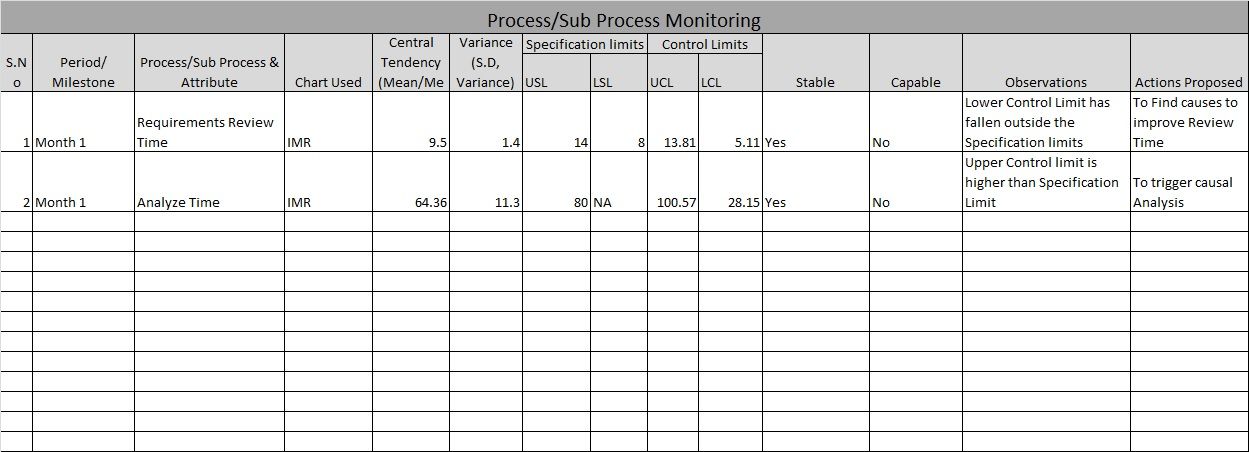
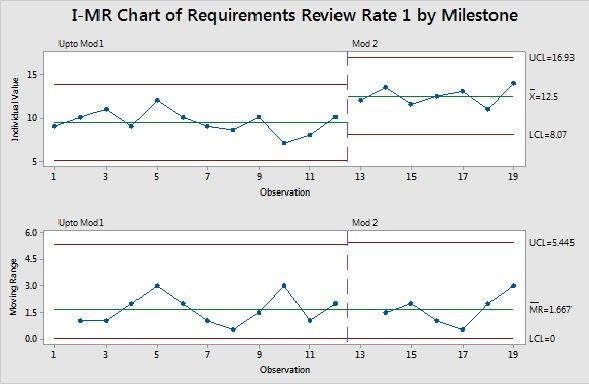
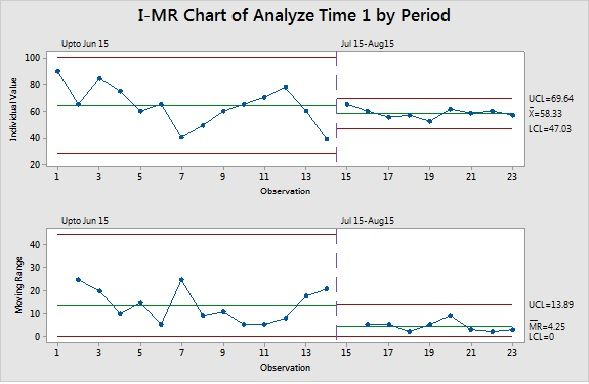
For example in our selected QPPO’s of Defect Density and SLA compliance the sub process measures which we monitor are Requirements Review Rate and Analyze Time, and both of them are monitored using control charts.
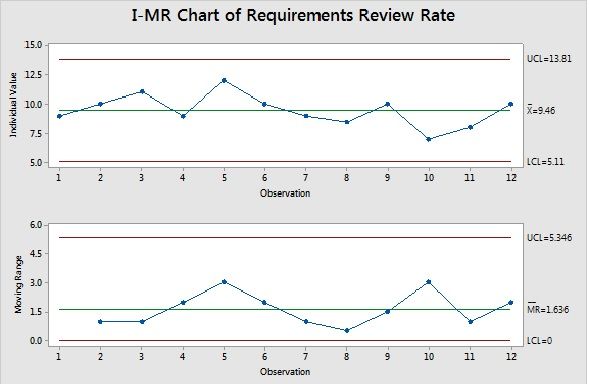
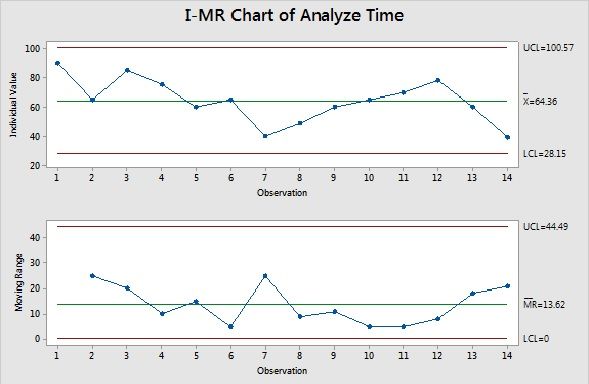
However as we do improvements to ensure process capability increases or due to unexpected changes in business conditions, the data points may go out of control , In such conditions it’s expected to take a note of such outliers and classify them as outliers due to planned change or not.
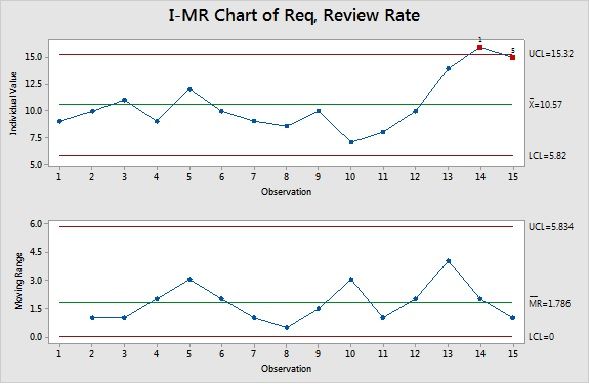
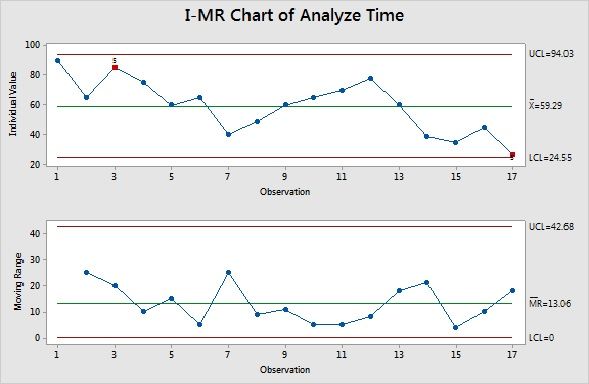
The purpose of control charts is to detect the changes quickly, however you may not decide to re-baseline the control limits as soon as you find a shift, instead we may need to see sufficient data to understand the variation/shift is significant and also for a minimum time period (so that the process shift is not because of seasonal impact). However it’s important to track the process change as soon as we find the shifts.
Once we have sufficient data, we have to perform relevant hypothesis testing to see if the data suggests if there is change in performance. When the hypothesis testing proves there is a change then the new baseline control limits can be established.
In addition its important to monitor the uncontrollable factors and how they perform, because a high variation in the trend may cause the predictions unreliable and can have effect in other factors/processes also.
Monitoring and achieving the Project Objectives
Using the PPM we understand the Process/Sub Process performance needs and we compose the processes accordingly. In addition with the PPM we understand on periodical/milestone basis the certainty or target/target achievement and take appropriate proactive actions. The actions can be related to change in process/sub process factors, change in projects’ influencing factors (people/competency, technology, tools, etc.) and where it’s not possible to make any proactive actions then it could be understanding of the risk level and transferring them where possible.
Beyond all these actions, its important for us to achieve the project QPPO in actuals, which would lead us to achieve Project objectives. Sometimes we have seen organizations have done all other practices clearly, however the entire purpose of Quantitative project/work management is to help us achieve the project Objectives using the project QPPO, which is given the least importance. Also we have to be clear that when the project objectives (which are measurable multiple times) are not meeting then even the QPPO could have met will be still considered as insufficient. In addition we have to understand the factors which influence that project’s objective and take actions appropriately.
In our given case of QPPO’s the Defect Density and SLA Compliance, has to be monitored for actual results on Milestone and periodical basis. When the values are crossing the thresholds it’s important to take relevant actions to prevent the re-occurrence.
Perform Root Cause Analysis:
The Root cause analysis is performed as a tool to ensure that Sub-Process/Process maintains the stability and be a capable process. In addition when the actual values of QPPO are not met, Root cause analysis helps in identifying the cause to address it. The actions proposed by the root cause analysis may quickly bring back the desired conditions or it can take long time also. It’s important to see when the actions are not quick enough it impacts the QPPO achievement, which means the business results are impacted. Hence the Project may seek additional actions, support and senior management drive to ensure they are able to perform to meet the objectives. The actions taken which is considered part of Quantitative management need not be elaborate and perform cost benefit and statistical tests, and it could be simpler addressing of cause with actions. This is an extension of Project monitoring and control process’s corrective action. We shouldn’t confuse it with Causal Analysis and Resolution.
What We Covered:
Quantitative Project/Work Management:
SG 1 Prepare for Quantitative Management
SP 1.1 Establish the Work Objectives
SP 1.2 Compose the Defined Process
SP 1.3 Select Subprocesses and Attributes
SP 1.4 Select Measures and Analytic Techniques
SG 2 Quantitatively Manage the Work
SP 2.1 Monitor the Performance of Selected Subprocesses
SP 2.2 Manage Work Performance
SP 2.3 Perform Root Cause Analysis
The simpler version of pictorial representation could be,