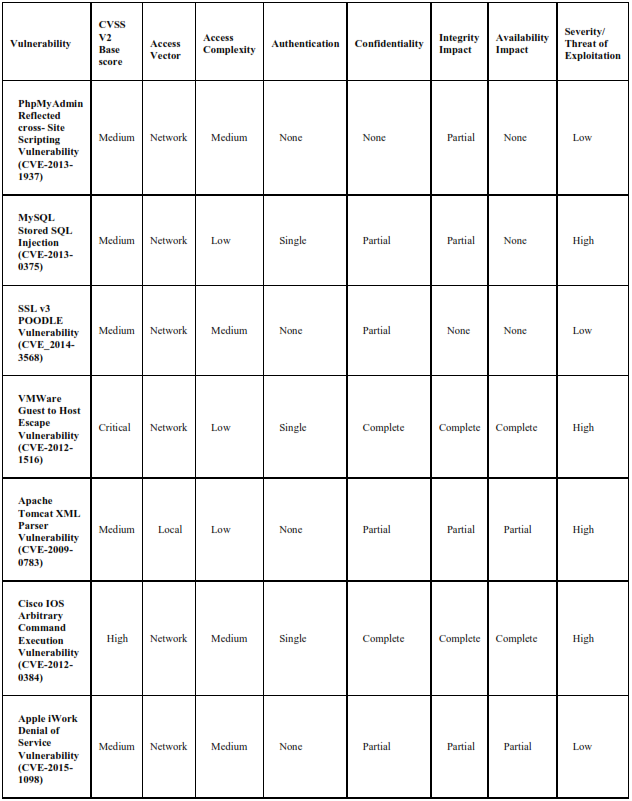
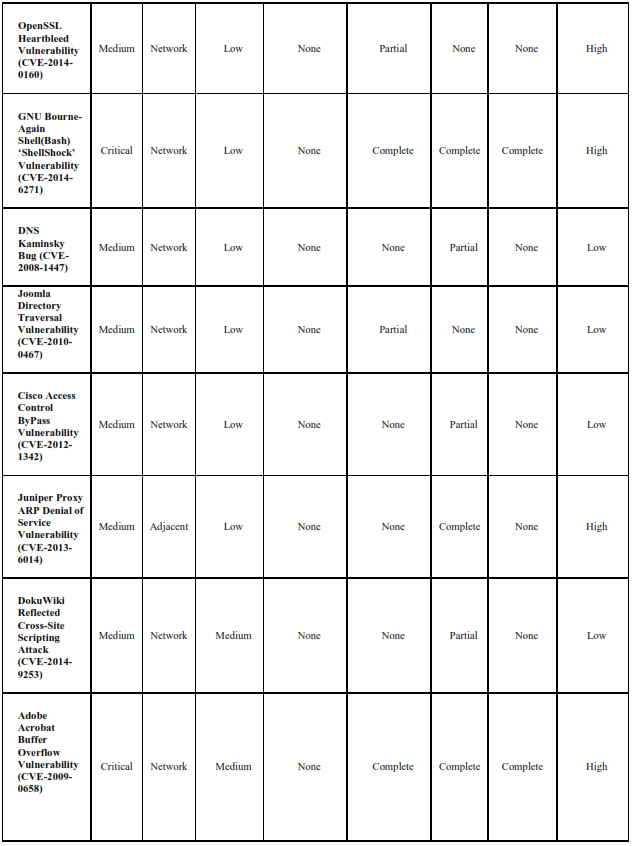
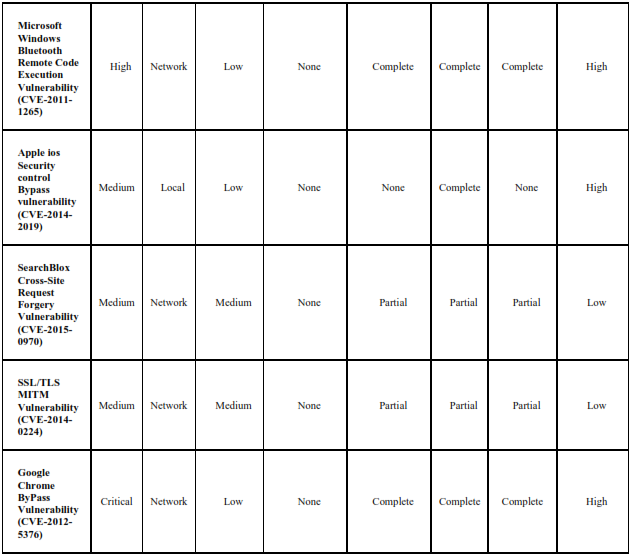
The values for CVSS (Version2) parameters: CVSS Score, Access Vector, Access, Complexity, Authentication, Confidentiality, Integrity and Availability for some common types of vulnerabilities such as PhpMyAdmin Reflected cross- Site Scripting Vulnerability (CVE-2013- 1937), MySQL Stored SQL Injection (CVE-2013-0375), SSL v3 POODLE Vulnerability (CVE_2014-3568), VMWare Guest to Host Escape Vulnerability (CVE-2012-1516), Apache Tomcat XML Parser Vulnerability (CVE-2009-0783), OpenSSL Heartbleed Vulnerability (CVE-2014-0160) etc. are tabulated in table 2.
TABLE 2: Frequency table for some common vulnerabilities using CVSS (version 2) Base Metrics
The likelihood table for finding the probabilities of various CVSS parameters : CVSS Score, Access Vector, Access, Complexity, Authentication, Confidentiality, Integrity and Availability, as defined in table 1, using the data presented in above frequency table (table 2) is depicted in table 3.
TABLE 3: Likelihood table for calculation of probabilities of CVSS (version 2) parameters
|
Severity/Threat of Exploitation |
|
|
P (High) = 12/21 = 4/7 |
P (Low) = 9/ 21 = 3/7 |
|
CVSS V2 Base score |
|
|
P (Low/ High) = 0/12 = 0 |
P(Low/ Low) = 0/9 = 0 |
|
P (Medium/ High) = 6/12 =1/2 |
P(Medium/ Low) = 9/9 = 1 |
|
P (High/ High) = 2/12 = 1/6 |
P(High/ Low) = 0/9 = 0 |
|
P (Critical/ High) = 4/12 = 1/3 |
P(Critical/ Low) = 0/9 = 0 |
|
Access Vector (AV) |
|
|
P (Local/ High) = 3/12 = 1/4 |
P (Local/ Low) = 0/9 = 0 |
|
P (Adjacent/ High)= 1/12 |
P (Adjacent/ Low) = 0/9 = 0 |
|
P (network/ High) = 8/12 = 2/3 |
P (Network/ Low) = 9/9 = 1 |
|
Access Complexity ( AC ) |
|
|
P (Low/ High) = 9/12 = 3/4 |
P (Low/ Low) = 3/9 = 1/3 |
|
P (Medium/ High)= 3/12 = 1/4 |
P (Medium/ Low) = 6/9 = 2/3 |
|
P (High/ High) = 0/12 = 0 |
P (High/ Low) = 0/9 = 0 |
|
Authentication (Au) |
|
|
P (None/ High) = 9/12 = 3/4 |
P (None/ Low) = 9/9 = 1 |
|
P (Single/ High)= 3/12 = 1/4 |
P (Single/ Low) = 0/9 = 0 |
|
P (Multiple/ High) = 0/12 = 0 |
P (Multiple/ Low) = 0/9 = 0 |
|
Confidentiality Impact (C) |
|
|
P (None/ High) = 2/12 = 1/6 |
P (None/ Low) = 4/9 |
|
P (Partial/ High)= 3/12 = 1/4 |
P (Partial/ Low) = 5/9 |
|
P (Complete/ High) = 7/12 |
P (Complete/ Low) = 0/9 = 0 |
|
Integrity Impact (I) |
|
|
P (None/ High) = 1/12 |
P (None/ Low) = 2/9 |
|
P (Partial/ High)= 2/12 = 1/6 |
P (Partial/ Low) = 7/9 |
|
P (Complete/ High) = 9/12 = 3/4 |
P (Complete/ Low) = 0/9 = 0 |
|
Availability Impact (A) |
|
|
P (None/ High) = 4/12 = 1/3 |
P (None/ Low) = 6/9 = 2/3 |
|
P (Partial/ High)= 1/12 |
P (Partial/ Low) = 3/9 = 1/3 |
|
P (Complete/ High) = 7/12 |
P (Complete/ Low) = 0/9 = 0 |
Let A be a sample vulnerability with CVSS parameters as:
<Medium, Local, Low, None, Partial, Partial, Partial>
The posterior probability of sample class A, for given set of CVSS parameters, is calculated from table 3 as:
P (A/High) × P (High)
= P (Medium/High) × P (Local/High) × P (Low/High) × P (None/High) ×
P (Partial/High) × P (Partial/High) ×P (Partial/High) × P (High)
P (A/High) × P (High)
= (1/2) × (1/4) × (3/4) × (3/4) × (1/4) × (1/6) × (1/12) × (4/7)
P (A/High) × P (High) = 36/258048
P (A/High) × P (High) = 0.0001395089
Now we will calculate P (A/Low) × P (Low) as:
P (A/Low) × P (Low)
= P (Medium/Low) × P (Local/Low) × P (Low/Low) ×
P (None/Low) × P (Partial/Low) × P (Partial/Low) × P (Partial/Low) × P (Low)
P (A/Low) × P (Low)
= (9/9) × (0) × (1/3) × (1) × (5/9) × (7/9) × (1/3) × (3/7)
P (A/Low) × P (Low) = 0
Now the highest posterior probability is calculated to be:
MAX {P (A/High) × P (High), P (A/Low) × P (Low)} = MAX {0.0001395089, 0}
MAX {P (A/High) × P (High), P (A/Low) × P (Low)} = 0.0001395089
Since {P (A/High) × P (high)} is evaluated to be greater than {P (A/Low) × P (Low)}, hence the sample vulnerability class A with the CVSS parameters as:
< Medium, Local, Low, None, Partial, Partial, Partial> is predicted to pose high threat of exploitation and thus should quickly be reported for immediate remediation, to prevent the hackers from stealing the valuable data.