How to trade Bitcoin smartly:
Technical analysis primer
You now know that bitcoins behave like usual shares or currencies. It means you can apply all the powerful methods of technical analysis — that's the collection of tools that was developed for professional traders and have made many of them astonishingly rich. Of course, you need to be smart (and, if you are reading this book, you definitely are!) to outsmart the market and the brave. And, we have to add the usual disclaimer: only invest money that you can afford to miss. Never invest borrowed money as you might end in deep trouble otherwise.
What is the idea of technical analysis in a nutshell? —It is very simple. You can gain much more for your investment if you do not just sit and wait, but rather use the cyclic character of price evolution and sell your stock (here bitcoins) when the price is high and buy them again when the price is low. To do it properly, you need to determine the trend and find the right moments when the trend is reversed.
Trend is your friend
Let us start with determining the trend. The easiest thing to do is to use a moving average. That is a very simple approach that you can try in your Excel spread sheet in a matter of minutes. I will show you how. The point is that the price always fluctuates. Your averaging algorithm has to smooth the fluctuation sufficiently, on one hand, while still showing you the changes in the trend as soon as they occur (this property is called responsiveness). Obviously, these two requirements are orthogonal, and you need to balance them. Simple moving average (SMA) involves just taking the price for a given day, add to it the prices at a given number of previous days and divide the sum by the total number of days. So, the value of every point of your SMA graph is (I take here an average over 10 days):

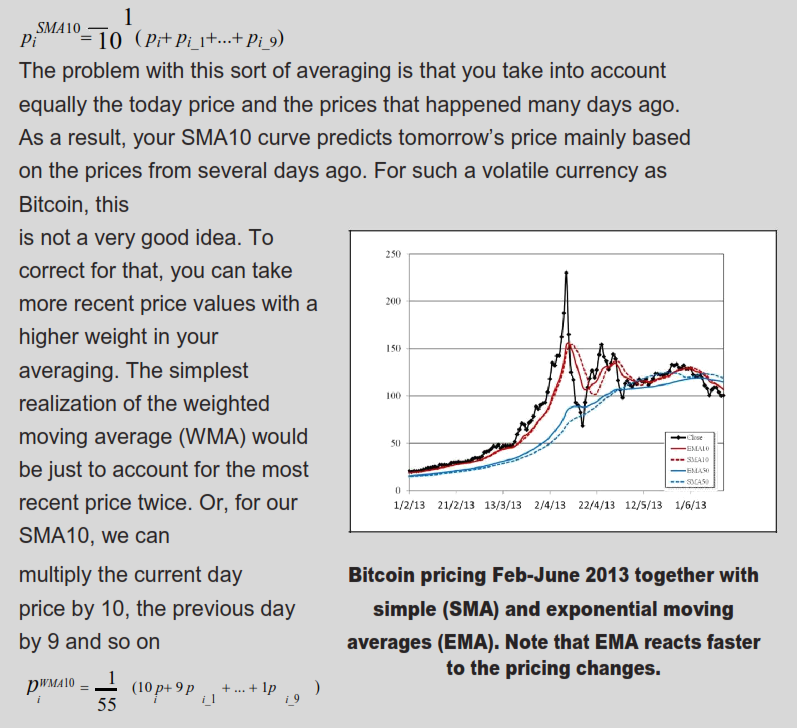
Another very commonly used approach is called exponential moving average (EMA). It works like an integrator or low pass digital filter. It is calculated recursively, so to calculate today's EMA, we need to know the EMA from yesterday and today's closing price:
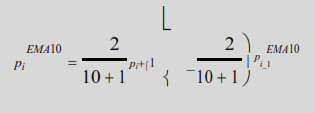
When we calculate the first point long-long time ago we can simply approximate EMA with SMA. If you compare EMA and SMA, you can notice that EMA reacts faster to the changes in trend, while SMA better reflects the average prices. The choice between them is your preference. You can also think about some other smart ways to make an average.
All these functions are easy to implement in Excel or any other software of your choice. I took some historic data from BTC-e and applied these averaging methods to obtain trend lines.
Spoiler Alert:
Sounds like really complicated geek stuff? How about trading on Autopilot with Bitcoin robot? By the end of our ebook, you will learn how you can profit with Bitcoin on Autopilot without need for any manual math crunching!