Security Analytics
 Call real time fault diagnostics for infrastructure and rolling stock monitoring through pattern recognition using artificial neural networks and knowledge based expert systems for fault detection and diagnosis.
 Graph Analytics
Fault Tree Analytics
FMEA Analytics
Data logging and event recording analytics
Event recording and data analytics
Online health monitoring analytics
Call threat analytics
Verify security intelligence of RailTech / EVs system at levels L1, L2, L3, L4 and L5;
Level1 [L1 - access control]:
Level2 [L2 - computing and communication schema]: fairness, correctness, transparency, accountability, trust, commitment, rationality;
Level3 [L3 - system performance] : robustness, consistency, liveness, reliability, resiliency, deadlock freeness, lack of synchronization, safety and reachability; Level4 [L4 - malicious attacks] : detect the occurrence of any malicious attack on the RailTech system.
Level5 [L5 - Business intelligence]: audit flaws in payment function computation.
Dr. Simon Rodrigues and Prof. R. Prakash are discussing on the security intelligence of emerging logistics technologies. It is essential to design electrical / hybrid vehicles in terms of security at various levels – L1, L2, L3, L4 and L5. Level L1 verifies system performance in terms of safety, reliability, consistency, stability, robustness and reach. The other critical design issues are also associated with resiliency, reachability, deadlock-freeness, synchronization and interactive intelligent communication among electrical / hybrid vehicles. Solid-state battery technology has higher energy density and tolerance to higher temperatures; may avoid the use of dangerous toxic materials, nonflammable and safer; can withstand higher voltage and longer life-cycle and support faster recharging rate. The safety of electrical / hybrid vehicles depends on access control at level L2 in terms of authentication, authorization of the drivers, correct identification of the system components and audit of quality control issues. The security schema is also designed and verified at level L3 in terms of fairness, correctness, transparency, accountability, trust and commitment. The safety of the electrical / hybrid vehicles may be threatened at level L4 through the corruption of various stakeholders such as car manufacturers, drivers, passengers and battery charging station supervisors. The design of the vehicles is expected to assess and mitigate the risks of various types of attacks at level L5 such as false data injection, sybil, shilling and traffic congestion.
Vehicle to Vehicle (V2V) Communication for Anti-collision System : The scope of emerging communication technology has been explored for intelligent V2V communication against the threats of accidents and collisions of vehicles on roads. The wireless technology is going through an evolution of a set of generations (1G 2G3G4G5GG7G). One of the most interesting applications of this emerging technology is Vehicle-to-Vehicle (V2V) communication, Most cars are expected to have a 4G or 5G cellular connection for V2V communication and the security of the drivers and passengers. 5G Automotive Association have been promoting C-V2X communication technology. It provides for communication between vehicles and communication between vehicles and infrastructures, leading to increase in autonomous self-driving cars and IOT (Internet of Things). The speed of 5G technology in upcoming self-driving cars may be vital in helping the capabilities of autonomous cars realize their full potential (Llanasas, 2019). Current 4G network doesn't possess the required speed needed to provide self-driving vehicles that could prevent catastrophic accidents or collision (Llanasas, 2019. 5G is expected to be the basic building block of anti collision system of next generation vehicles.
5G is the fifth generation wireless technology for digital cellular networks with wide deployment in 2019. The frequency spectrum of 5G is classified as millimeter waves, mid band and low band. Low band uses a similar frequency range as 4G. 5G millimeter wave is the fastest having actual speeds 1–2 Gbit/s down. Frequencies are above 24 GHz reaching up to 72 GHz, above lower boundary of extremely high frequency band. 5G mid-band is the most widely deployed in over 20 networks; speed in a 100 MHz wide band is 100–400 Mbit/s down. 5G low-band offers similar capacity to advanced 4G; latencies between 25 -35 milliseconds. 5G networks are digital cellular networks in which the covered service area is divided into cells. Analog signals (e.g. sounds, images) are digitized by an analog-to-digital converter and transmitted as a stream of bits. All 5G wireless devices in a cell communicate by radio waves with a local antenna array and low power automated transceiver in the cell, The local antennas are connected with telephone network and Internet through a high bandwidth optical fiber or wireless backhaul connection. A mobile device crossing from one cell to another is automatically handed off seamlessly to the new cell.
6G (sixth generation) is the successor to 5G cellular technology; 6G networks are expected to use higher frequencies, higher capacity and much lower latency than 5G networks. 6G is a wireless technology that is beyond 5G. China has officially launched R&D works for 6G mobile networks. It would be about a decade before 6G comes along, NTTDoCoMo has presented the evolution of wireless technology from 3G in 2000s, 4G in 2010, 5G in 2020 and it is reasonable to expect 6G in 2030. It is not exactly known how fast 6G will be yet. It may be governed by the standards of International Telecommunication Union (ITU). If everything connects together using 5G, 6G with higher data speeds and lower latency makes instant device-to- device connection possible in various application such as autonomous cars, drones and smart cities, integration of our brains with computers and greatly improved touch control systems. 7G is the next generation communication technology. It is being adopted in Norway, China, Japan and other developed countries of the world. In Norway, Internet speed is fastest. Utilizing superior design and technology, 7G Network is expected to deliver millions of calls reliably every day,
The air interface defined by 3GPP for 5G is known as New Radio (NR), and the specification is subdivided into two frequency bands, FR1 (below 6 GHz) and FR2 (mmWave) each with different capabilities. The next issue is frequency range 1 (< 6 GHz ); maximum channel bandwidth defined for FR1 is 100 MHz, the most widely band is around 3.5 GHz. For frequency range 2 (> 24 GHz), minimum channel bandwidth defined for FR2 is 50 MHz and the maximum is 400 MHz, From the perspective of performance analysis; 5G speeds are expected to range from
~50Mbit/s to over 2Gbit/s even 100Gbit/s, 100x faster than 4G. The fastest 5G, known as mmWave, delivers speeds of up to and over 2Gbit/s. The latency of 5G is 8–12 milliseconds. It is governed by International Telecommunication Union's IMT- 2020 standards.
Next, let us consider the deployment of 5G, Nine companies sell 5G radio hardware and 5G systems for carriers- Altiostar, Cisco Systems, Datang Telecom, Ericsson, Huawei, Nokia, Qualcomm, Samsung and ZTE. Large quantities of new radio spectrum (5G NR frequency bands) have been allocated to 5G. 5G devices include Samsung Galaxy S10 5G. The technology is expected to be available in Australia, Argentina, Bulgaria, Canada, China, Finland, Germany, India, Monaco, Netherlands, New Zealand, Norway, Pakistan, Philippines, Romania, Russian Federation, San Marino, South Africa, South Korea, Taiwan, Thailand, Uruguay, Vietnam, Qatar, Mexico, USA, Sweden and Panama.
ITU-R has defined three main uses for 5G as faster and reliable connection - Enhanced Mobile Broadband (eMBB), Ultra Reliable Low Latency Communications (URLLC), and Massive Machine Type Communications (mMTC). Only eMBB is deployed in 2019; URLLC and mMTC are several years away in most locations. eMBB uses 5G as a progression from 4G with faster connections, higher throughput, and more capacity; mMTC is expected to connect a large number of low power, low cost devices, which have high scalability and increased battery lifetime, in a wide area. 5G technology may connect some of 50 billion connected IoT devices. So far, we have discussed the strength of the emerging wireless technologies. But, there are various constraints such as interference, security, surveillance and health concerns. The spectrum used by remote sensing, weather and Earth observation satellites will potentially be significant without effective controls. The technology has health concerns; the radiation could have adverse health effects. There are concerns of data security and privacy, surveillance concerns, threats of potential espionage of foreign users by 5G equipment vendors.
Internet of Things (IoT) : Internet of Things is the integration of several technologies and communications solutions such as identification and tracking technologies, wired and wireless sensor and actuator networks, enhanced communication protocols shared with next generation Internet and distributed intelligence for smart objects fitted with EVs / HVs. IoT can be effectively used for assisted driving, transportation and logistics domain. Advanced cars, trains, buses, bicycles, roads and transported goods are becoming equipped with sensors, RFID tags, actuators and processing power. These objects can send important information to traffic control sites for better transportation planning, effective route optimization for energy saving, tracking of delivery time and delay, faults and monitoring in the supply chain and transportation network. These objects can provide important information to the driver and/or passengers of a car to allow better navigation, safety, collision avoidance systems and monitoring of transportation of hazardous materials.
Real-Time Fault Diagnostics (RTFD) : The fourth element of deep analytics is security. Please refer to five test cases as discussed in section 9. We have analyzed those cases and outline the aforesaid security schema comprehensively. It is essential to monitor and detect faults of a complex real-time system; assess the chance of various types of faults and explore efficient and reliable fault detection and isolation methods based on artificial intelligence [30]. The basic building blocks of real-time fault diagnostics are soft computing and AI methods such as knowledge based expert system, model based system, if-then rule based system, artificial neural network (ANN), fuzzy logic, genetic algorithm (GA), decision tree and Bayesian network. It is possible to monitor real-time system, faults detection, diagnosis and correction at process and functional levels through a set of quantitative and qualititative performance metrics.
Faults may occur due to various reasons such as failure of hardware components (e.g. sensors, triggers), environmental factors (e.g. noise) and flaws in software (e.g. algorithms, logic, coding, protocols, invalid and incorrect inputs and feedback, knowledge base, inference mechanism and knowledge representation). There are other constraints such as inconsistency in knowledge base and flaws in knowledge engineering, learning errors and data visualization. Traditionally, track geometry is monitored using accelerometers and camera; cracks in tracks are detected through non-destructive test; measurements are acquired through various sensors of specialist trains and data is analyzed on the train. If the value is above predetermined threshold, then it requires the effort of the experts to identify and diagnose the faults.
Real-time fault diagnostics are basically condition monitoring systems having three core components: (a) data logging and event recording system, (b) event recording and data analytics and (c) online health monitoring system. The first component can detect faults (e.g. change in logic and operation time), can give hard evidence of accidents and other abnormal conditions caused by the malfunctioning of RailTech system and also can record the performance and status of critical equipments and operations in the form of digital data. On-Train Maintenance Recorder (OTMR) is equivalent to a black box and may use GPS and other sophisticated systems for real time data communication.
The second component may have intelligent data analytics (e.g. statistical analysis, sequence mining) and remote access to critical data. The second component may record door opening time, traction current and energy usage. Track based monitoring is useful for the verification of the performance of vehicles such as monitoring of wheel with strain gauge or fibre optic sensors and the monitoring of hot axles boxes.
The third component is basically knowledge based expert system which can collect digital and analog data from various critical equipments, analyze sensed data, compare with an inbuilt database of healthy and simulated faulty operational modes, flag alarms and recommend diagnosis to the drivers and maintenance workforce. Automated system verification is essential for scalability and robustness in fault diagnosis. The basic building blocks of RTFD are following three analytics the output of the same is fed to DAS.
Graphical Analytics [GA]
Call Graphical Analytics; Verify robustness and consistency of RailTech system performance;
 Time : Sense failure propagation in dynamic systems through [TFPG = F, D, E, M, ET, EM, DC, DS]; [ TFPG ]
Control flow [Control Flow Analytics (CFA)]
Resources flow [Resources Flow Analytics (RFA)]
Data flow [Data Flow Analytics (DFA)]
Detect, isolate and correct problems early and re-allocate resources as per demand. Output :
The graphical analytics (GA) analyze RailTech System performance from the perspectives of four dimensions: time, control flow, resources flow and data flow. TFPG considers only time failure but ignores the other important aspects of vehicle diagnostics such as control, resources and data flows. RTFD is expected to give a comprehensive view of system failure not only in terms of time delay but also flaws in control, data and resource flows. It is an interesting research agenda whether a single graph can show the propagation of different types of failures in system performance from the perspectives of time delay and flaws in resource, data and control flows simultaneously and comprehensively.
Time Failure Propagation Graph (TFPG) : Timed Failure Propagation Graph is a rich formalism and is used to model the occurrence and propagation of failure and their direct and indirect effects, Boolean combinations of faults, time delays, events and state transitions in the design of real-time fault diagnostics of a complex, autonomous and dynamic system. There are several important issues: no critical state of a system should be ignored; no spurious and nonexistent sate should be considered for analysis; it is essential to perform fault detection, isolation and recovery, sense and compute time delays between events correctly and validate completeness and tightness of the graph through intelligent model checking algorithms. TFPG can model and reason the issues of spurious and missing alarms, intermittent faults and reduction of a large scale vehicle diagnostics system. It is an interesting open research agenda whether TFPG can verify performance of RailTech system in terms of reliability, consistency, liveness, safety, robustness, stability, deadlock freeness and reachability comprehensively.
Timed Failure Propagation Graph is a directed graph model (Figure 7.4); the structure has a set of nodes (V) and edges (E). The nodes represent failure modes (F) i.e. root events of the propagations of failure and discrepancies (D) i.e. possible deviations from nominal behavior caused by failure modes. Failure modes do not have any incoming edges; discrepancies must have at least one incoming edge and must be reachable from a failure mode node. Circular paths are possible. Edges (E) model the dependency between the nodes (V = F D) and capture propagation of time delays; the edges can be activated or deactivated based on a set of operation modes (M). ET is a map that associates every edge with minimum and maximum propagation time (tmin,tmax) of a failure. EM is a map that associates every edge with a set of modes in M. DC: D is a map defining the type of each discrepancy either AND or OR.
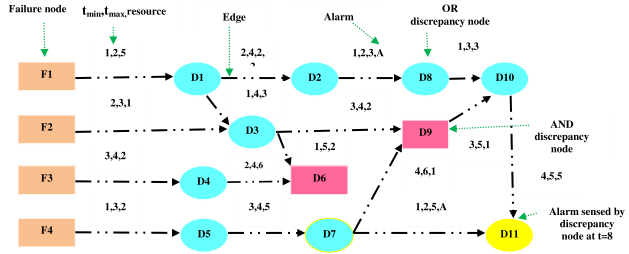
Figure 7.4: Time Failure Propagation Graph
Is there any other type discrepancy apart from AND or OR such as NAND, NOR, NOT, XOR and loop? Section 5.1.1.2 gives an overview of various types of control flow patterns in RailTech system. DS: D is a map defining monitoring status of discrepancy as either M when (discrepancy is monitored by alarm) or U (when the discrepancy is not monitored). A TFPG transition system is represented by S = (X,I,T) where X is a set of state variables; I(X) is initial state, X’ is next state of X and T represents transition relation. A state s of S is an assignment to the state variable of X. A trace of s is an sequence  := s0,s1,...sn such that so = I(X) and (si,si+1) = T(X,X’).
Control Flow Analytics [CFA]
System : RailTech system (Mechanical, Electrical, Electronics, Information system : Driver Advice System [DAS], Communication system);
Assess risks: Verify correctness, reliability, consistency, liveness, deadlock freeness, synchronization and reachability in control flows.
Mitigate risks.
Resource Flow Analytics [RFA]
System: RailTech system (Mechanical, Electrical, Electronics, Information and Communication system), smart coaches;
Assess risks: Verify correctness, and fairness of resource management;
Mitigate risks:
o Monitor health of critical system components (e.g. wheels) through sensors, CCTVs, smoke detectors, Fire extinguishers, IoT and integrated information system.
o Real-time fault detection: Detect defects and major causes for derailments and delays and deterioration in tracks, running trains and other rail infrastructure.